












 0 comments





Key Takeaways:
- Build Salesforce ROI around measurable time savings and cost avoidance rather than inflated revenue projections.
- Include licenses, implementation, admin time, add-ons, and ongoing costs when calculating total Salesforce investment.
- Establish baseline metrics before implementation so improvements can be measured and defended later.
- Use a realistic 50%, 75%, and 100% adoption ramp instead of assuming full benefits from year one.
- Build conservative, expected, and optimistic scenarios, then commit to the conservative case when presenting to finance.
- Use $3.10 returned per $1 spent (Nucleus Research, 2023) as a CRM-wide reference point. The $8.71 figure from 2014 is outdated.
Quick Answer: Salesforce ROI is calculated by comparing the net business gain against the total investment, including licenses, implementation, administration, and add-ons. A defensible business case should focus on measurable time recovery and cost avoidance, model revenue gains cautiously, establish baseline metrics before launch, and account for a realistic adoption ramp.
Most published Salesforce ROI figures would not survive a finance review. The 998% figure repeated on statistics pages comes from one small business, 5P Consulting, which used Salesforce Starter and reported the result after 18 months in a Salesforce customer story. Partner sites advertise returns of 340% or more; the one we checked cites a “Forrester study” with no title, year or link.
The more defensible benchmark is far lower. Nucleus Research’s August 2023 analysis of 63 CRM case studies found an average return of $3.10 per $1 spent. That covers CRM in general. For Salesforce specifically, Nucleus’s 2020 analysis of 15 deployments costing over $1 million found about $5 per $1 and a payback of roughly 8 months. Both are samples of case studies, so treat them as reference points, not promises.
This guide covers how to build a case with numbers you can defend when someone in finance starts asking where they came from. That starts with understanding exactly what Salesforce is being used to do, because the ROI case should be tied to the processes and capabilities the platform is actually replacing or improving.
The Formula, and Its Weak Point
ROI = (Net Gain ÷ Investment Cost) × 100
The arithmetic is trivial. Everything difficult sits in the two inputs.
Investment cost is the easier half, and most business cases still get it wrong by counting licenses only. If the implementation involves significant customization, integrations, or workflow redesign, the cost of Salesforce consulting services should also be accounted for rather than treating implementation as a one-time technical expense. In the worked example below, licenses are about 42% of year-one cost. Your share will depend on implementation scope. That calculation should also account for the Salesforce products and add-ons your organization actually uses, because the CRM license is only one part of the wider platform investment.
Net gain is where cases fall apart. It’s the sum of four benefit categories, and they are not equally defensible.
Four Benefit Categories
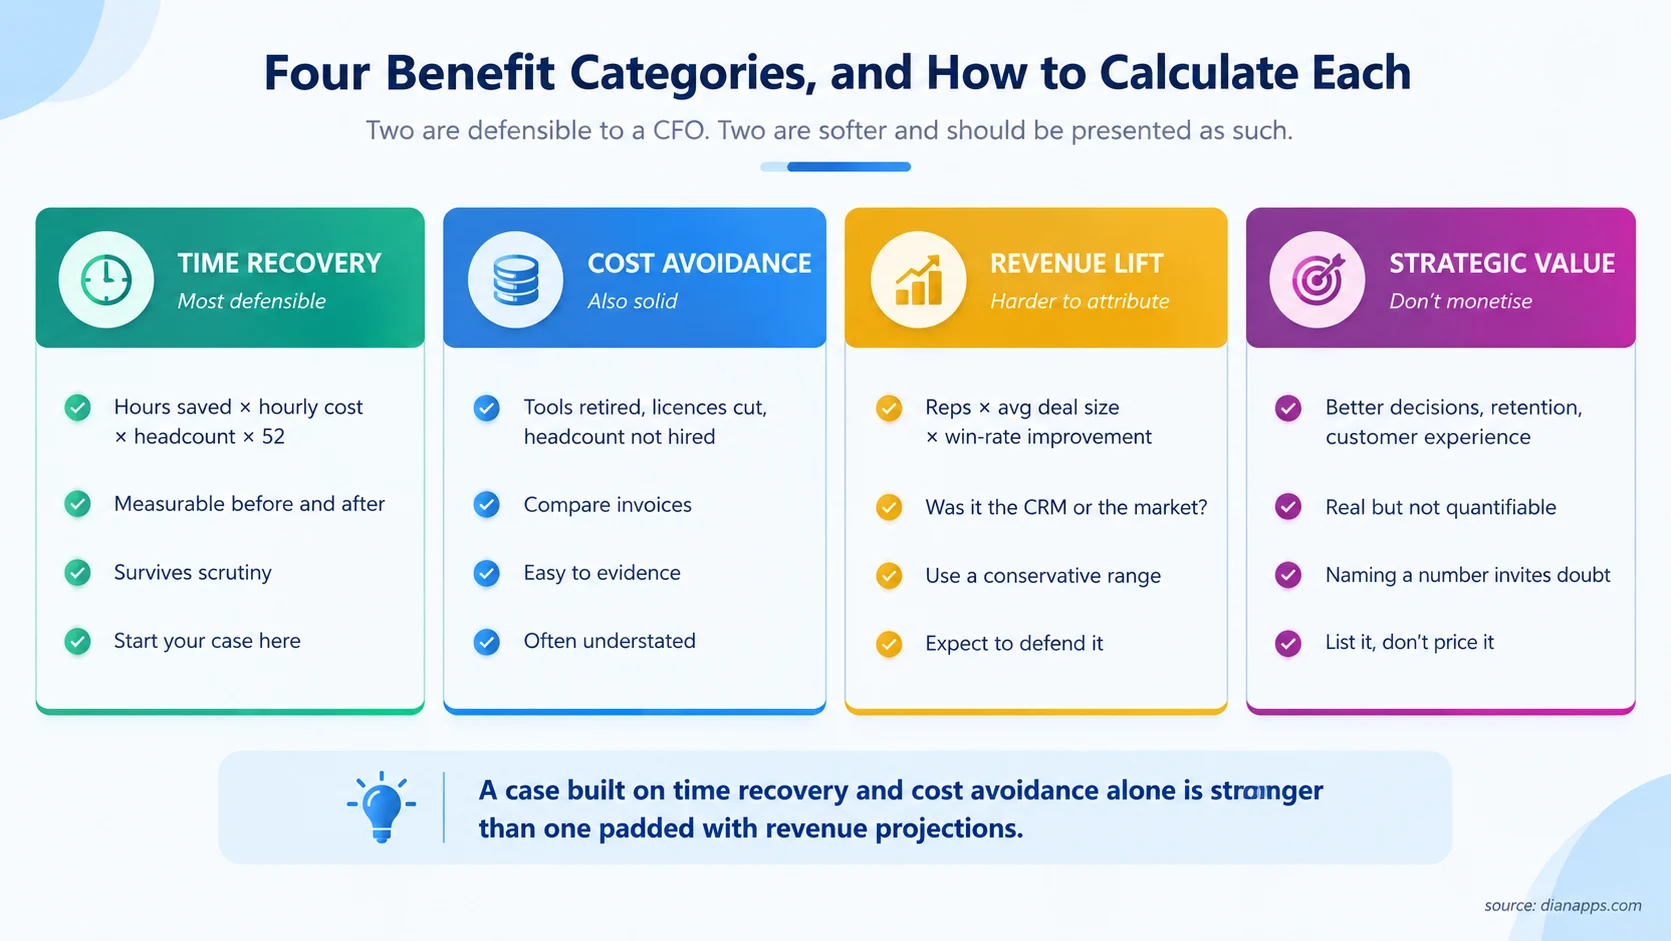
Time recovery is your strongest ground.
Hours saved per person per week × hourly cost × headcount × 52
It is measurable before and after, and the arithmetic is transparent. Finance will still ask whether the saved hours turn into cash, so say what happens to them: fewer hires, less overtime, or more selling time. Salesforce’s own research puts reps’ selling time at about 40% of the week (CRM ROI guide, citing its State of Sales report), which is why this is the usual place to start. Start every business case here.
- Cost avoidance is nearly as solid: Tools retired, licenses cancelled, headcount not hired. You can evidence it with invoices, and it’s frequently understated because people forget the small subscriptions that disappear.
Revenue lift is where cases get challenged.
Qualified opportunities × average deal size × win-rate gain (in percentage points) × gross margin
Salesforce’s own CRM ROI guide lists the inputs to baseline: win rate, conversion rate, average deal value, sales cycle length, and revenue per employee. It does not publish a single win-rate benchmark, so use your own pipeline data. Count the gain at gross margin, not revenue, because ROI measures profit. Present it as a range and expect to defend the attribution: proving the CRM caused the lift, rather than the market or a pricing change, is hard.
Strategic Value, List It, Don’t Price It: Better decisions, improved customer experience, staff retention. These are real, they matter, and attaching a dollar figure to them invites exactly the skepticism that undermines the numbers you can defend.
The benefits will also vary depending on which part of Salesforce your business is using. A sales-focused implementation has a different value model from one built around service, marketing, commerce, or another cloud, so a Salesforce clouds comparison can help define which processes should actually appear in the ROI model.
A case built on time recovery and cost avoidance alone is stronger than one padded with revenue projections. Counterintuitive, and true.
Salesforce’s own guide splits benefits differently: sales productivity, revenue uplift, customer retention and cost to serve. If you run Service Cloud, add churn and cost per case to your baseline, because retention and cost to serve are where service teams show value.
Baseline Before You Start
This is the single most common failure, and it’s unfixable after the fact.
You cannot prove improvement without a before number. If you don’t measure the current state, then in eighteen months you’ll be arguing that things feel better, which is not a business case outcome.
What to capture before go-live:
| Metric | Why it matters |
| Hours per week on manual data entry | The backbone of time recovery |
| Average sales cycle length | Cycle-time improvement is measurable |
| Win rate by segment | Needed to evidence revenue lift |
| Cases resolved per agent per day | Service productivity baseline |
| Time to onboard a new hire | Ramp savings |
| Cost of tools you plan to retire | Cost avoidance, with invoices |
| Report production time | Frequently the largest hidden saving |
| Cost per case (fully loaded) | The cost-to-serve baseline for Service Cloud and Agentforce |
| Customer churn or renewal rate | The retention baseline |
Assign an owner and a reporting cadence to each one. A baseline nobody re-measures is just a spreadsheet.
Model the Ramp
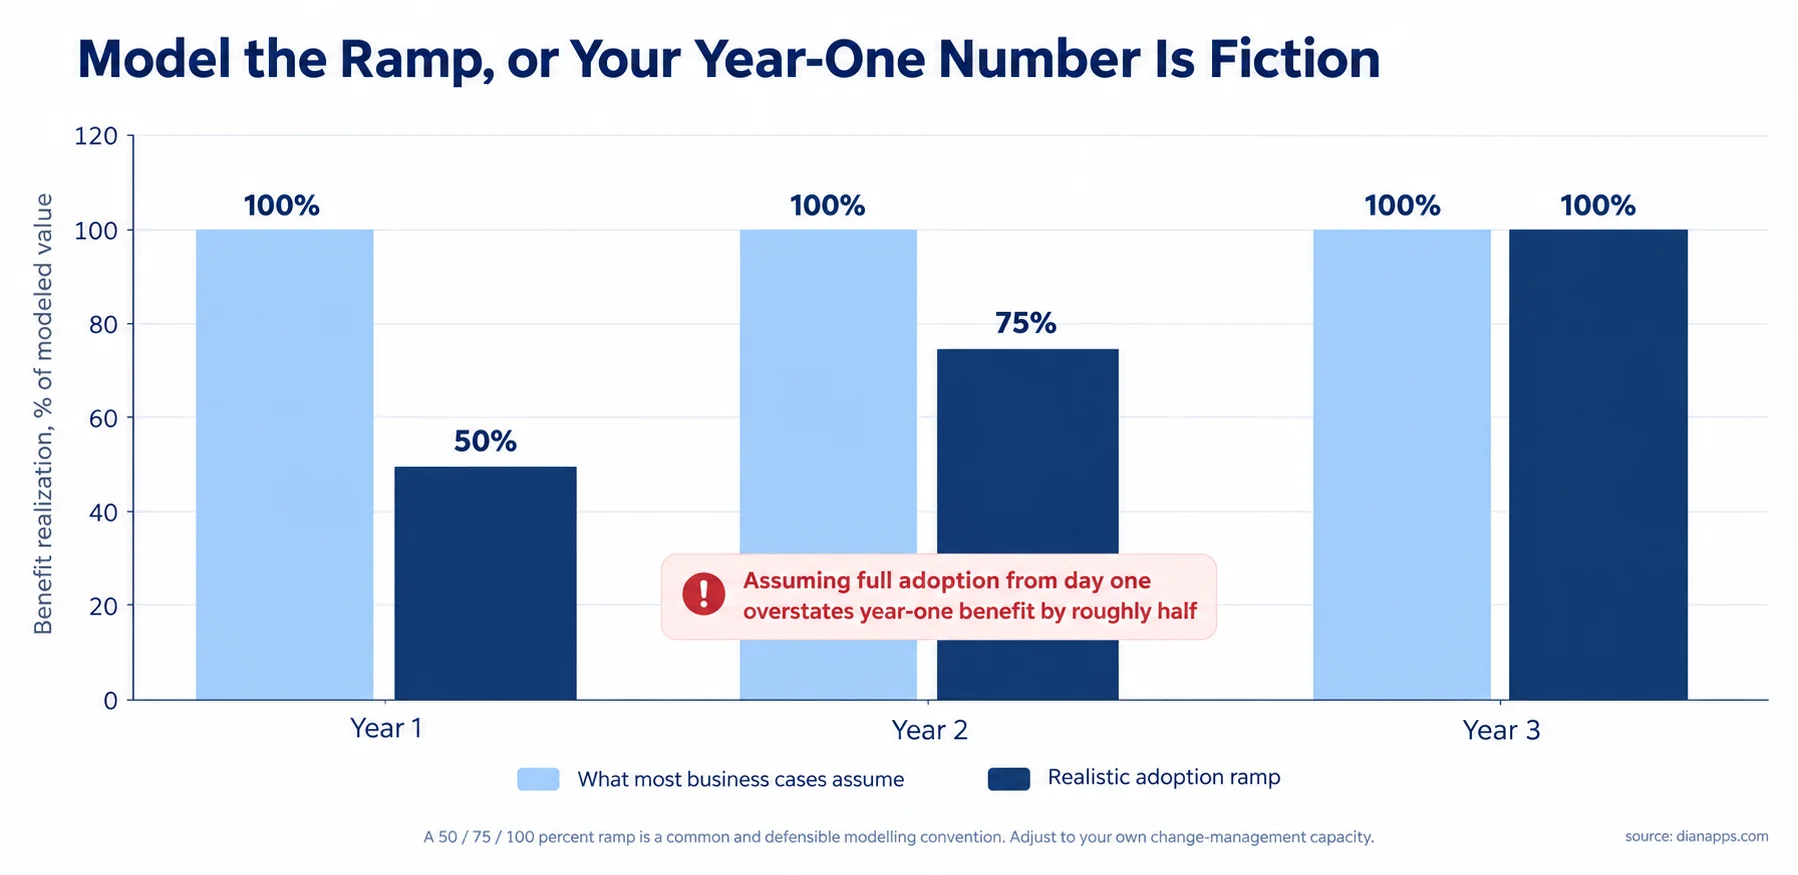
Assuming full benefit from day one roughly doubles year-one value compared with a 50% ramp.
A common and defensible convention is 50% of modeled benefit in year one, 75% in year two, 100% in year three. Adjust it to your own change-management capacity; a well-resourced rollout with a dedicated owner ramps faster than one bolted onto someone’s existing job.
- Why This Matters Commercially: A case that shows full benefit immediately looks naive to anyone who has run a software rollout. Showing the ramp signals that you’ve thought about adoption, which is the thing that actually determines whether the benefits arrive.
- It Changes the Payback Calculation Materially: Published payback figures vary widely. Nucleus found about 8 months across 15 large Salesforce deployments in its 2020 study, and a Forrester study commissioned by Salesforce found under 6 months for an Agentforce service deployment. Both are best-case samples. With a 50/75/100 ramp, the worked example below pays back in about 13 months.
Build Three Scenarios, Not One
Salesforce’s own CRM ROI guide recommends this, and it is better advice than most partner content offers.
Commit to the conservative number; if you present the optimistic case and deliver the expected one, you’ve failed against your own projection despite a genuinely good outcome.
Set the inputs from your own adoption rate, wage levels and project scope instead of copying a benchmark.
Claims That Won’t Survive Scrutiny
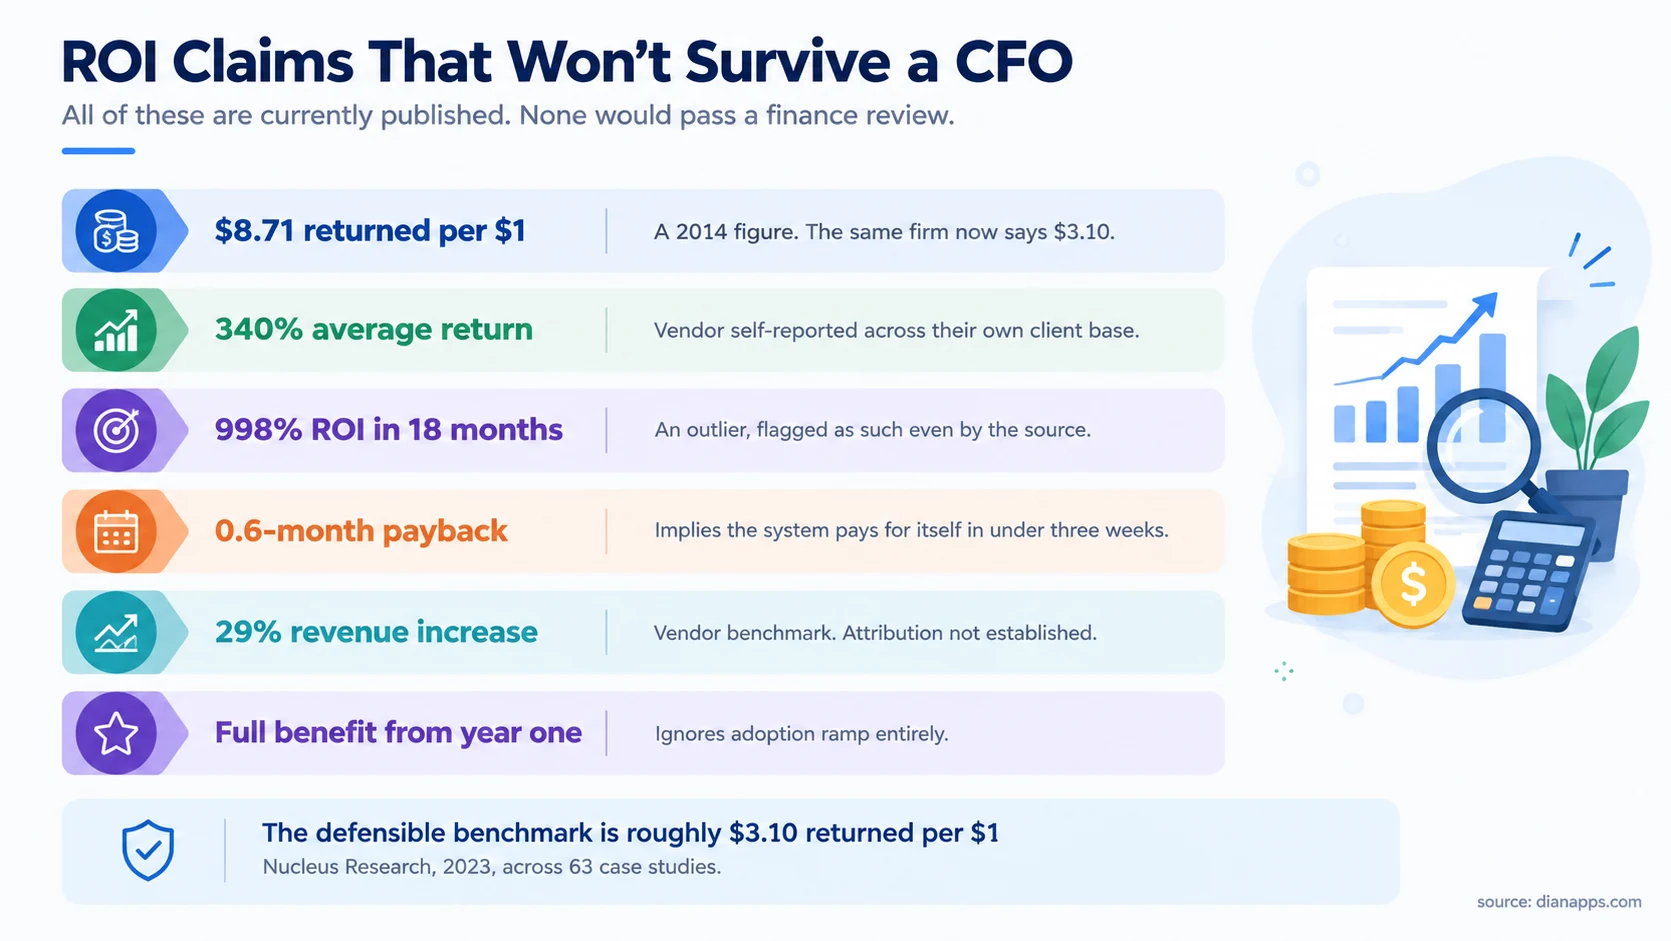
Every figure above is currently published somewhere. The $8.71 figure appears on CRM statistics pages as though it describes today. It comes from a June 2014 Nucleus report. Nucleus’s 2023 analysis puts the CRM average at $3.10 and says the return was $4.90 a decade earlier, so the two studies used different samples and should not be compared directly.
How to sanity-check any ROI claim you’re handed:
Who produced it?
- A vendor or partner reporting on its own client base is not independent research.
What’s the sample?
- “Across 500+ companies we implemented” is self-selected. Nucleus’s 63 case studies with a stated methodology is different in kind.
What year?
- ROI benchmarks age badly. Nucleus attributes the drop from $4.90 to $3.10 to growing system complexity and the difficulty of integrating new features.
Does the payback period pass a smell test?
- Anything under six months for a full multi-cloud implementation deserves questions. Narrow rollouts can pay back faster: Nucleus reported under three months on average for Salesforce Field Service deployments in 2021.
Related: CRM statistics 2026
Need a Salesforce ROI Model You Can Defend?
Build a Salesforce business case around your actual costs, adoption ramp, measurable benefits, and realistic scenarios.
Salesforce ROI Benchmarks You Can Cite
These are the published figures worth quoting, with the sample behind each. None is a forecast for your company.
| Benchmark | Result | Sample | Date |
| Nucleus, CRM overall | $3.10 returned per $1 spent | 63 CRM case studies from the prior decade | Aug 2023 |
| Nucleus, Salesforce deployments over $1M | About $5 per $1; payback about 8 months | 15 Salesforce deployments | Jan 2020 |
| Nucleus, Salesforce vs other CRMs | $0.88 more per $1 (51.76% higher return rate) | 30 case studies, 2018 to 2020 | Jun 2021 |
| Nucleus, Salesforce Field Service | $3.17 per $1; payback under 3 months | Case studies from 2018 onward | Jun 2021 |
| Forrester TEI, Agentforce for service | 396% ROI over 3 years; payback under 6 months | Composite organization, 50 reps, 500,000 cases in year one; commissioned by Salesforce | Nov 2025 |
| 5P Consulting | 998% ROI in 18 months | One small business on Salesforce Starter; an outlier | Dec 2024 |
| Nucleus, CRM overall (outdated) | $8.71 per $1 | Older case studies | Jun 2014 |
A Worked Example
A 50-person sales and service organization with all 50 users on a $195 per-user-per-month license. That is Sales Cloud Core, the edition that replaced Enterprise for new buyers on 3 September 2026 (see Salesforce pricing). Existing Enterprise contracts keep their current price, so check your order form.
Costs, year one:
| Line | Amount |
| Licenses (50 × $195 × 12) | $117,000 |
| Implementation | $90,000 |
| Internal admin time | $50,000 |
| Add-ons and storage | $20,000 |
| Total year one | $277,000 |
The Ramp
| Year 1 (50%) | Year 2 (75%) | Year 3 (100%) | |
| Benefit | $253,800 | $380,700 | $507,600 |
| Cost | $277,000 | $187,000 | $192,000 |
| Net | −$23,200 | $193,700 | $315,600 |
Benefits, modelled at 100% then ramped:
| Benefit | Calculation | Full value |
| Time recovery – sales | 4 hrs/week × $45 × 30 reps × 52 | $280,800 |
| Time recovery – service | 2 hrs/week × $35 × 20 agents × 52 | $72,800 |
| Cost avoidance | Three tools retired | $34,000 |
| Revenue lift (conservative) | 1,200 opportunities × $10,000 × 1-point win-rate gain = $120,000 revenue, counted at an assumed 60% gross margin | $72,000 |
| Full annual benefit | $459,600 |
Now apply the ramp:
| Year 1 (50%) | Year 2 (75%) | Year 3 (100%) | |
| Benefit | $229,800 | $344,700 | $459,600 |
| Cost | $277,000 | $187,000 | $192,000 |
| Net | −$47,200 | $157,700 | $267,600 |
Payback lands about 13 months in, early in year two. Over three years, the example returns $1,142,100 in benefits against $656,000 in costs. That is a net gain of $486,100, or 74% ROI ($1.74 returned per $1 spent). It sits below Nucleus’s $3.10 CRM average because the example uses a deliberate 50/75/100 ramp and a modest revenue lift. That is the point of building a conservative case.
Note What The Honest Version Does: Year one is slightly negative. A case showing a positive first year is usually one that skipped the ramp, and a CFO who has seen a software rollout before will spot it.
Agentforce ROI: A Different Cost Model
Agentforce changes the cost side of the ROI formula. Sales Cloud and Service Cloud charge per user. Agentforce can charge per use. Salesforce’s Agentforce pricing page lists Flex Credits at $500 per 100,000 credits, a standard action at 20 credits ($0.10), a conversation at $2, and an add-on at $125 per user per month for Sales, Service, and Field Service. Check the page for current figures before you model. Our Salesforce pricing guide covers Agentforce pricing in more detail.
The formula changes too:
Net savings = (cases the agent handles × your fully loaded cost per case) − Agentforce usage cost − Data Cloud and integration cost − time spent reviewing the agent’s work
Here is an illustrative case. Replace every input with your own.
| Input | Value |
| Cases per month | 10,000 |
| Share the agent handles | 30% |
| Cases handled | 3,000 |
| Human cost per case, fully loaded (placeholder) | $12 |
| Agentforce cost per conversation | $2 |
| Monthly saving | 3,000 × ($12 − $2) = $30,000 |
| Annual saving, before other costs | $360,000 |
The 30% sits inside the 25% to 35% case-deflection range that Forrester assumed in its Agentforce study. The $12 per case is a placeholder, not a benchmark. The result is before Data Cloud, integration, implementation and review time, so it is a ceiling. Check your contract for how conversations that escalate to a human are billed.
Forrester’s Total Economic Impact study, commissioned by Salesforce, modeled a composite organization with 50 service reps and 500,000 cases in year one. It reported 396% ROI over three years and assumed a 50% cut in case-handling time. Treat it as the best case a vendor can show, then swap in your own inputs. Salesforce also publishes an Agentforce ROI calculator for service teams, which is fine for a first estimate. For how Agentforce differs from earlier Salesforce AI, see Agentforce vs Einstein.
Salesforce ROI by Cloud
| Cloud | What to baseline | Independent ROI figure found |
| Sales Cloud | Win rate, sales cycle length, selling time | None. Salesforce publishes customer results, not a benchmark. |
| Service Cloud and Agentforce | Cost per case, handle time, deflection | Forrester TEI, 396% (commissioned by Salesforce, Nov 2025) |
| Field Service | Cost per visit, repeat visits | Nucleus, $3.17 per $1 (Jun 2021) |
| Revenue Cloud | Quote-to-cash cycle time, quote errors | None found |
| Manufacturing Cloud | Forecast accuracy, order accuracy | None found. See Salesforce for manufacturing. |
We found no independent ROI figure for Sales, Revenue, or Manufacturing Cloud. Build those cases from your own baseline instead of quoting a vendor number.
Tracking Value After Launch
Most business cases are written, approved, and never revisited. That’s a missed opportunity in both directions.
Re-measure your baseline metrics on a fixed cadence, quarterly for the first year, then annually. Same metrics, same method, same owner.
Report against the conservative scenario, which is what you committed to.
Expect the shape to differ from the model. Some benefits arrive faster than projected, others don’t arrive at all. That’s normal and worth documenting, because it makes your next business case more credible.
And use the data at renewal. An organization that can evidence delivered value negotiates from a stronger position than one that can’t. See how to reduce Salesforce license costs.
Turn Your Salesforce Business Case Into Results
Hire experienced Salesforce developers to build, customize, integrate, and optimize your Salesforce environment around the outcomes in your ROI model.
When the Honest Answer Is No
Worth stating, since almost nobody writing about Salesforce ROI does.
If your process is simple and your team is small, the numbers frequently don’t work. A ten-person team with a straightforward pipeline will struggle to generate $265,000 of annual benefit, and a cheaper tool will deliver most of the value.
If you have no owner for the system, model the benefits at a much lower ramp or don’t proceed. Adoption is the variable that determines everything, and it doesn’t happen on its own.
If your data is poor, fix that first. A CRM built on bad data produces reports nobody trusts, and no ROI model survives that.
Related: Salesforce vs custom CRM · Salesforce for startups and SMBs
Where to Go Next
For the cost side of the equation, Salesforce pricing 2026 and editions compared.
For reducing the investment figure, how to reduce Salesforce license costs.
For the benchmark data and why published figures disagree, CRM statistics 2026.
For what implementation actually costs, Salesforce customization cost.
For whether the platform fits at all, Salesforce vs custom CRM, Salesforce alternatives and Salesforce for startups and SMBs.
For protecting adoption, which is what determines whether any of this arrives, how to choose an implementation partner.
The Number You Commit To Is the One That Matters
There’s a temptation to present the best case, because it gets approved faster. It also sets the bar you’ll be measured against eighteen months later.
A conservative model that you beat is a better outcome than an optimistic one you miss, and it’s the difference between a second budget request that gets approved and one that doesn’t.
Ready to Build Your Salesforce Business Case?
Share your current Salesforce costs, processes, and growth plans with our team, and let’s work through the numbers, assumptions, and implementation requirements together.
 0 comments








Your email address will not be published. Required fields are marked *