















 0 comments





Governor limits are the reason code that works perfectly in a sandbox falls over in production.
The two everyone knows, 100 SOQL queries and 150 DML statements, are the easy ones. They have an obvious cause and a five-minute fix; the ones that cost real time are CPU time exceeded and heap size too large, because neither has a single offending line. They’re accumulated inefficiency, and most guides don’t cover them at all.
This is the full reference, plus the fixes for the errors you’re actually seeing.
Quick Answer: Limits are per transaction, and everything firing on that save shares them: your trigger, other triggers, Flows, validation rules, managed packages. Sync gets 100 SOQL / 150 DML / 10 seconds CPU / 6MB heap. Async roughly doubles CPU and heap but not SOQL rows or DML. When you genuinely can’t optimise further, Batch Apex resets the limits per chunk; that’s the escape hatch.
Why Governor Limits Exist
Salesforce Is Multi-Tenant: Your org shares infrastructure with thousands of others on the same instance. Limits stop any one tenant from monopolising shared resources.
The Practical Consequence: A governor limit exception cannot be caught and handled. When you hit one, the transaction throws a runtime exception and rolls back entirely. There’s no degradation, no warning, no partial success. That’s why limits shape architecture rather than sitting in a performance-tuning backlog.
The Full Reference Table
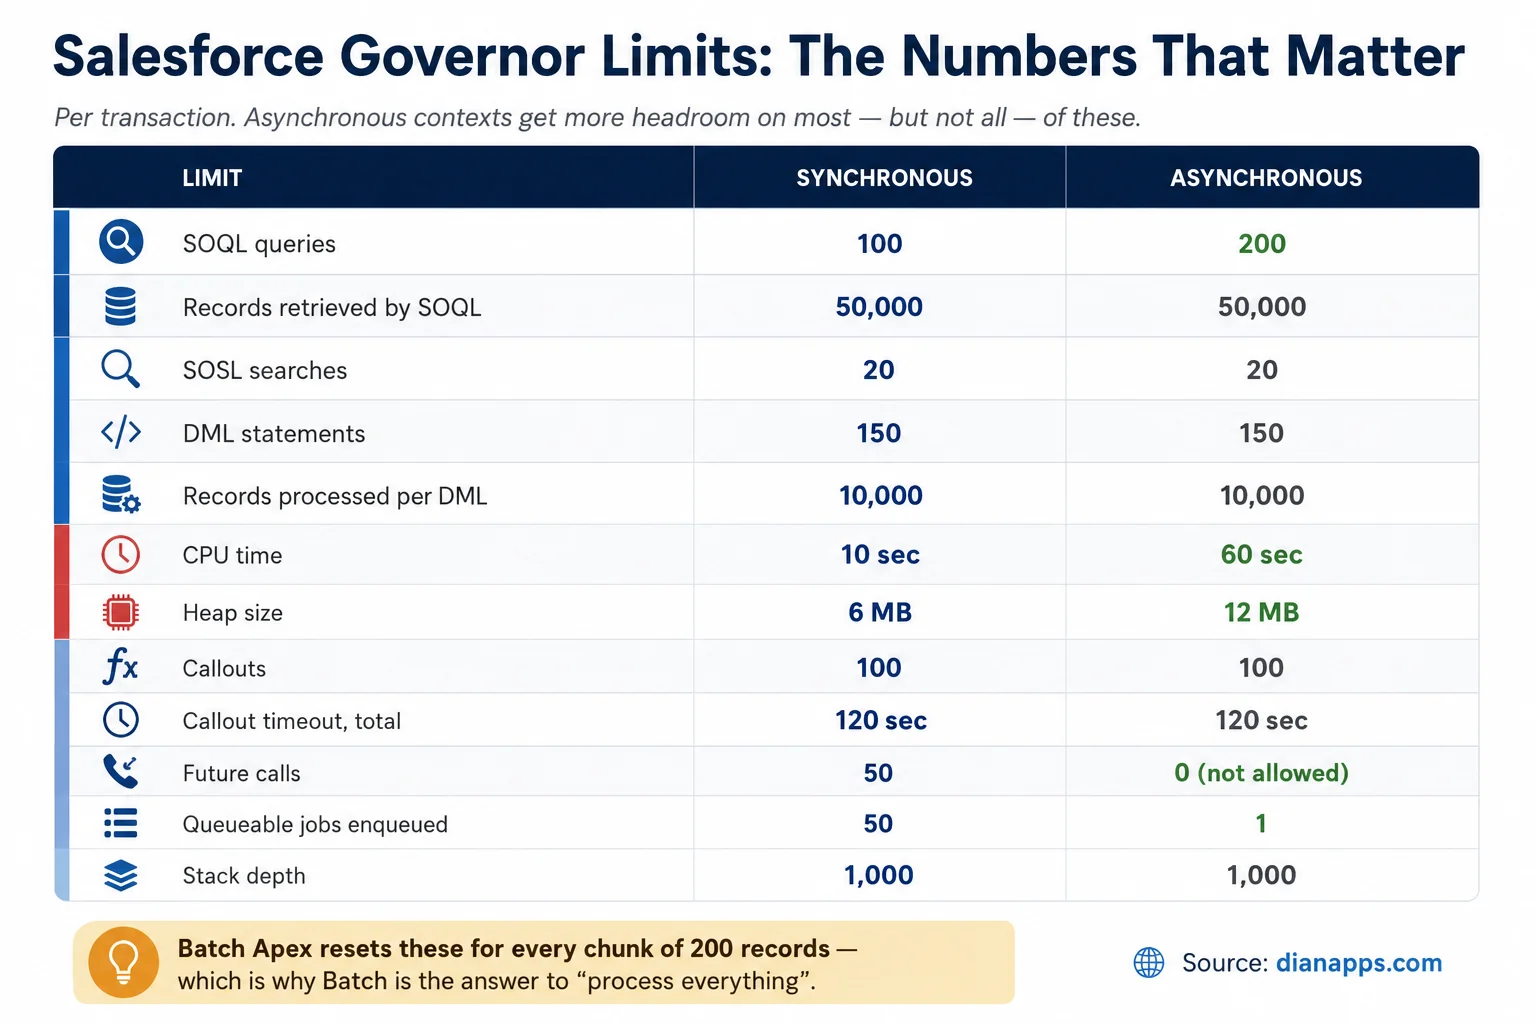
Two things to read from that table.
- Async Doesn’t Double Everything: CPU time goes from 10 to 60 seconds and heap from 6MB to 12MB – a genuine difference. But SOQL query rows stay at 50,000, and DML statements stay at 150. Moving work async solves CPU and heap problems; it doesn’t solve volume problems.
- Batch Apex Is Different Again: Limits reset for every chunk of 200 records, which is why Batch is the answer to “I need to process everything” rather than Queueable.
Beyond per-transaction limits, there are also static limits (Apex code size, currently 6MB per org), Lightning Platform limits (API calls per 24 hours, based on edition and licence count), and size-specific limits. Most of those are soft and can be raised by Salesforce Support. The per-transaction ones above are hard.
Everything on One Save Shares One Budget
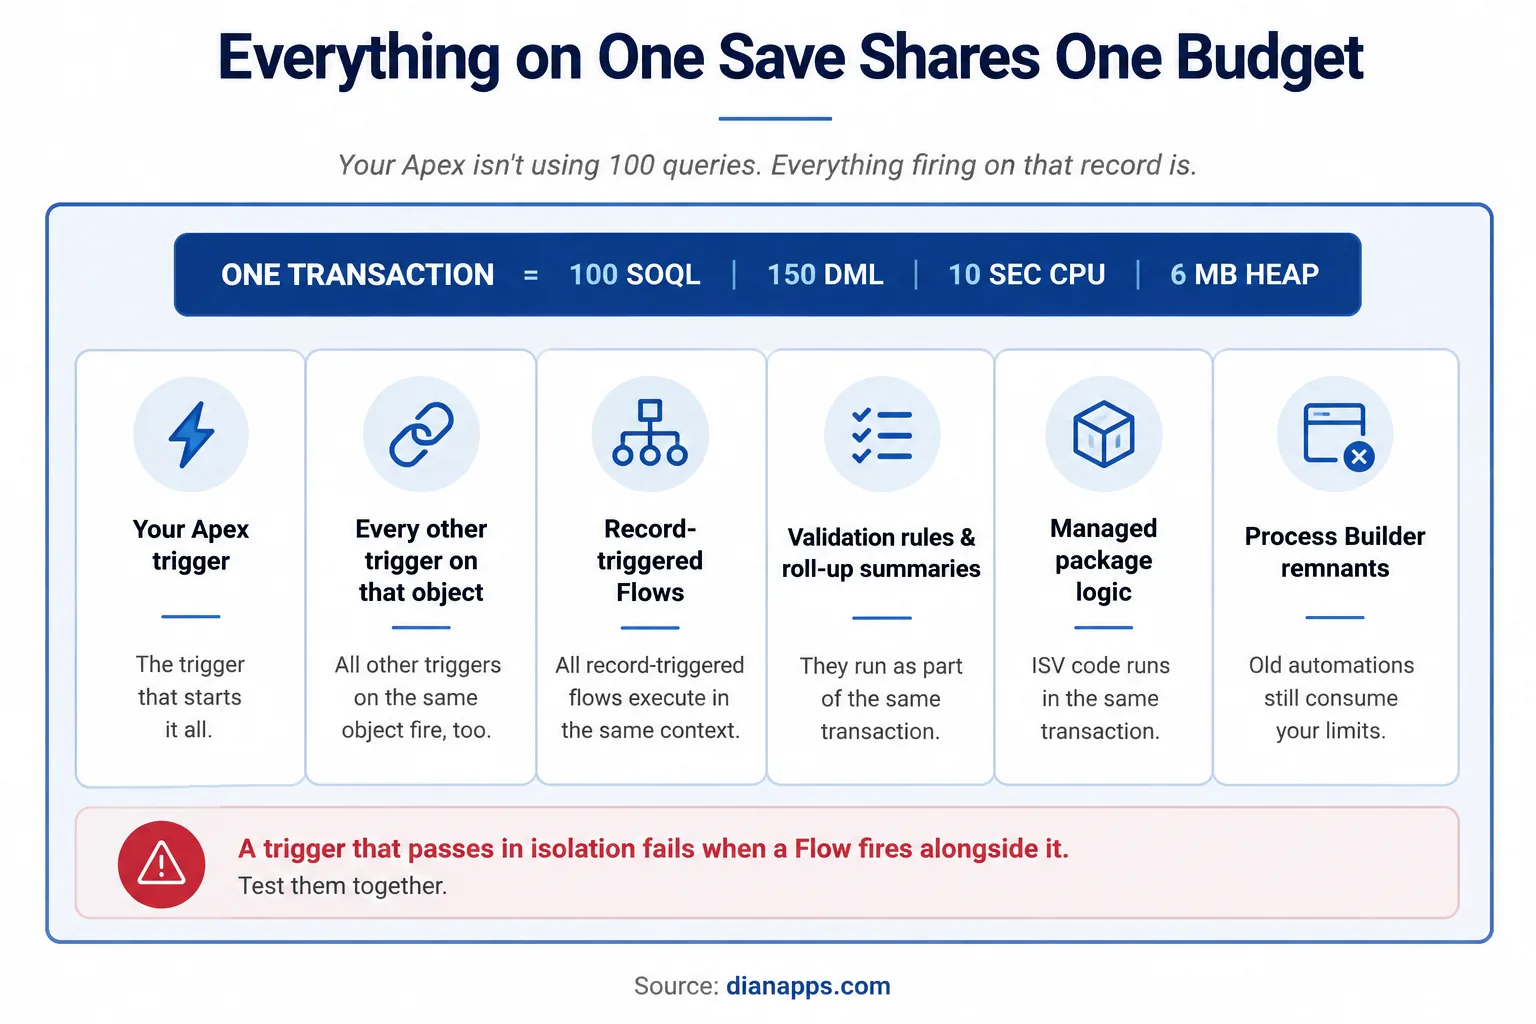
This is the part that catches people out: Your trigger isn’t allocated 100 queries. The transaction is, and every automation firing on that record draws from the same pool.
A trigger that passes every test in isolation fails in production because a Flow fires alongside it and a managed package adds three more queries. If you’re debugging a limit exception you can’t reproduce, check what else runs on that object. Flow Trigger Explorer shows every record-triggered Flow on an object in execution order.
Related: Salesforce Flow · Flow vs Apex
The Errors You’re Actually Seeing
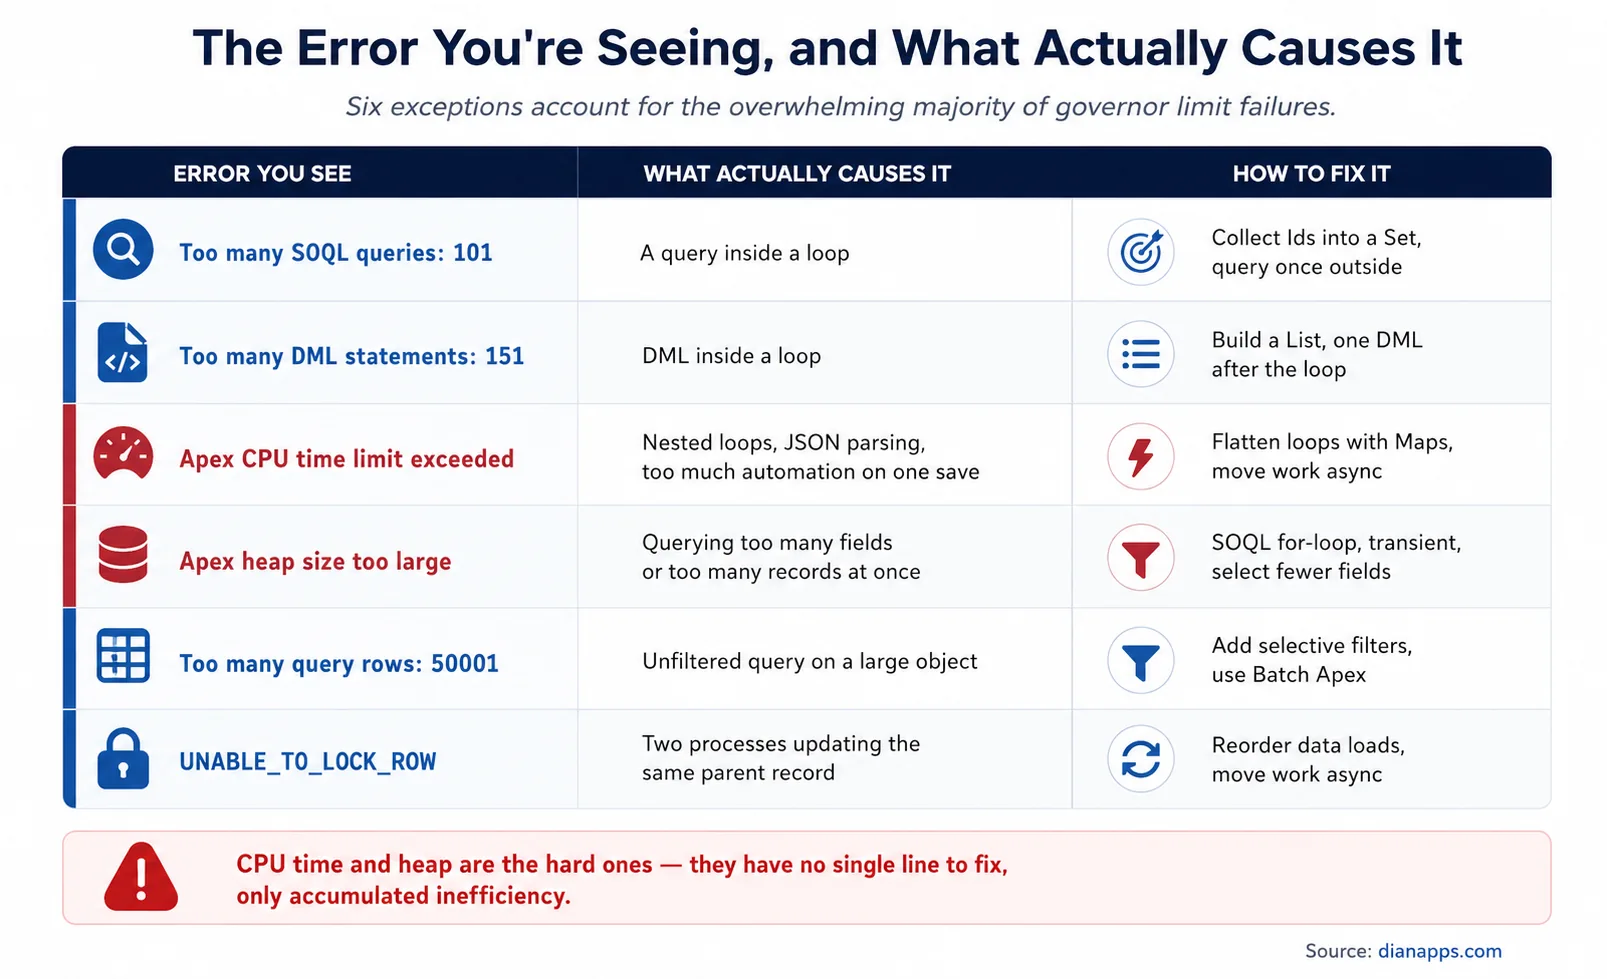
Too many SOQL queries: 101
Cause: A query inside a loop: 200 records, 200 queries, blown at 100.
|
1 2 3 4 5 6 7 8 9 10 11 12 |
// ✗ for (Contact c : contacts) { Account a = [SELECT Name FROM Account WHERE Id = :c.AccountId]; } // ✓ One query, any volume Set<Id> accountIds = new Set<Id>(); for (Contact c : contacts) accountIds.add(c.AccountId); Map<Id, Account> accounts = new Map<Id, Account>([ SELECT Id, Name FROM Account WHERE Id IN :accountIds ]); |
The pattern never changes: collect into a Set, query once outside the loop into a Map, loop again to apply.
Too many DML statements: 151
Cause: DML inside a loop. Same shape, lower ceiling.
|
1 2 3 4 5 6 7 |
// ✓ Build the list, one DML afterwards List<Contact> toUpdate = new List<Contact>(); for (Contact c : contacts) { c.Description = 'Updated'; toUpdate.add(c); } if (!toUpdate.isEmpty()) update toUpdate; |
A collection of 10,000 records costs one DML statement. That’s the whole point of bulkification.
Apex CPU time limit exceeded
The Hard One: There’s no single line to fix; it’s accumulated processing across the entire transaction.
Real Causes, In Rough Order Of Frequency:
- Nested loops: Looping a list inside another loop is O(n²). At 200 records, that’s 40,000 iterations.
- Too Much Automation On One Object: Three triggers, four Flows, a dozen validation rules, all counted.
- JSON Serialisation And Deserialisation of large structures.
- Describe Calls Inside Loops: Schema.getGlobalDescribe() is expensive; call it once and cache it.
- Complex Formula Fields And Roll-Up Summaries recalculating on save.
- String Concatenation In Loops: Use a List<String> and String.join() instead.
Fixes:
|
1 2 3 4 5 6 7 8 9 10 11 12 13 14 |
// ✗ O(n²) - nested loop for (Account a : accounts) { for (Contact c : contacts) { if (c.AccountId == a.Id) { /* ... */ } } } // ✓ O(n) - Map lookup Map<Id, List<Contact>> byAccount = new Map<Id, List<Contact>>(); for (Contact c : contacts) { if (!byAccount.containsKey(c.AccountId)) byAccount.put(c.AccountId, new List<Contact>()); byAccount.get(c.AccountId).add(c); } |
Note that SOQL and DML wait time doesn’t count toward CPU time; only your processing does. If your transaction is slow but the CPU is fine, the problem is query performance, not code. See the SOQL guide.
When you can’t optimise further: move work asynchronously; Async gets 60 seconds instead of 10.
Apex heap size too large
Cause: Holding too much in memory at once, usually too many records or too many fields on them.
Fixes:
- Select fewer fields: Every field on every record consumes heap.
- Use a SOQL for-loop, which processes in chunks of 200 and releases memory between them:
|
1 2 3 |
for (List<Account> batch : [SELECT Id, Name FROM Account WHERE Industry = 'Banking']) { for (Account a : batch) { /* process */ } } |
- Mark variables transient in Visualforce controllers so they aren’t serialised into view state.
- Null out large collections when you’re finished with them.
- Move to Batch Apex for genuinely large volumes.
Too many query rows: 50001
Cause: A query returning more than 50,000 rows across the transaction.
Fix: Add selective filters on indexed fields or use Batch Apex with a QueryLocator, which handles up to 50 million records.
UNABLE_TO_LOCK_ROW
Not strictly a governor limit, but it appears in the same debugging sessions. Two processes updating the same record, commonly a bulk load hitting the same parent account repeatedly or a Flow and a trigger colliding.
Fix: order your data loads to avoid contention, reduce batch size, or move work asynchronously.
Get Your Salesforce Limits Under Control
Get expert help diagnosing governor limit failures, optimizing Apex, reducing automation overhead, and designing transactions that scale safely.
Instrumenting Your Code: The Limits Class
You don’t have to guess how close you are; the Limits class tells you at runtime:
|
1 2 3 4 |
System.debug('SOQL used: ' + Limits.getQueries() + ' of ' + Limits.getLimitQueries()); System.debug('DML used: ' + Limits.getDmlStatements() + ' of ' + Limits.getLimitDmlStatements()); System.debug('CPU used: ' + Limits.getCpuTime() + ' of ' + Limits.getLimitCpuTime()); System.debug('Heap used: ' + Limits.getHeapSize() + ' of ' + Limits.getLimitHeapSize()); |
Use it defensively in bulk-processing code:
|
1 2 3 4 |
if (Limits.getQueries() > Limits.getLimitQueries() - 10) { // approaching the limit - defer the rest System.enqueueJob(new ContinueProcessingQueueable(remaining)); } |
That pattern: Checking the budget and handing the remainder to an async job is how genuinely large processing jobs stay inside limits.
For Diagnosis: Enable a debug log with Apex profiling, and the Limits section at the bottom of the log shows exactly what the transaction consumed. That’s faster than adding debug statements when you’re investigating someone else’s code.
When Optimising Isn’t Enough: Async Strategies
Some workloads genuinely can’t fit in a synchronous transaction. The escape hatches, in order of when to reach for them:
| Approach | Gets you | Use when |
|---|---|---|
| Queueable | 60s CPU, 12MB heap, chainable | Moderate work that can happen slightly later |
| Batch Apex | Limits reset per 200-record chunk | Large volumes - up to 50 million records |
| Platform Events | Decoupled, separate transaction | Fire-and-forget integration work |
| Scheduled Apex | Runs on a clock, usually calling Batch | Nightly or periodic processing |
Batch Apex Is The Important One: Because limits reset for every chunk, a batch job processing 100,000 records gets 100 SOQL queries per chunk of 200, not 100 in total. That’s the difference between impossible and routine.
Full detail: Apex programming guide
Design Patterns That Keep You Under Limits
- Always assume 200 records; never Trigger.new[0].
- One trigger per object, delegating to a handler. Multiple triggers mean unpredictable execution and duplicated queries.
- Query Once, Use A Map: The single most valuable habit in Apex.
- Query Only The Fields You Need. Heap and CPU both benefit.
- Cache Describe Calls. Expensive and rarely need repeating.
- Use Before-Save Flows: For same-record updates, they consume no DML at all.
- Consolidate Automation: Overlapping Flows and triggers on one object multiply cost.
- Run PMD or Apex Code Analyzer in CI: It catches SOQL and DML in loops before review. See Salesforce DevOps.
- Test with 200+ records: Because that’s what production sends.
Need More Salesforce Engineering Capacity?
Add experienced Salesforce developers to optimize Apex, refactor automation, and keep complex workloads within platform limits.
Where to Go Next
For the language these limits constrain, see the Apex programming guide – particularly the bulkification and async sections.
For query efficiency and selectivity, the SOQL and SOSL guide.
For declarative automation drawing on the same budget, Salesforce Flow and Flow vs Apex.
For catching these issues before they reach production, Salesforce DevOps and sandboxes.
The complete Salesforce development guide is the hub.
When Limits Become an Architecture Problem
One trigger hitting a limit is a bug, while an org where limits are hit routinely is a design problem – usually too much automation on too few objects, accumulated over years by people who’ve since left.
We’re a certified Salesforce Consulting Partner, and Salesforce Development Services are often part of this remediation work: mapping what fires on save, consolidating overlapping automation, restructuring triggers into a proper framework, and moving what genuinely needs to be async.
Or if you need help with a specific limit you can’t get past, our Salesforce development team can pair with your developers.
 0 comments











Leave a Comment
Your email address will not be published. Required fields are marked *