















 0 comments





Key Takeaways:
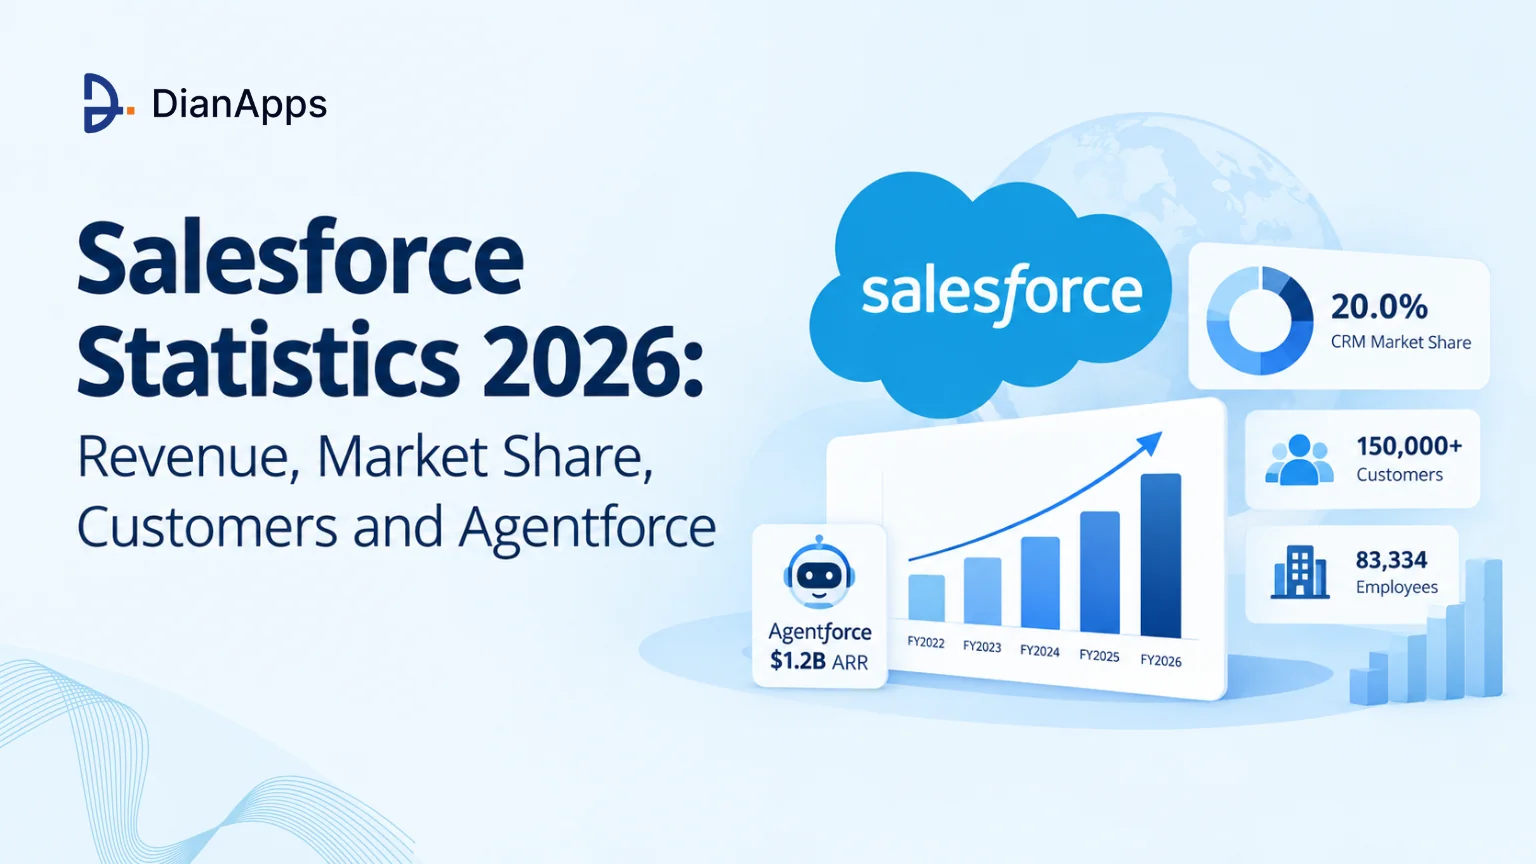
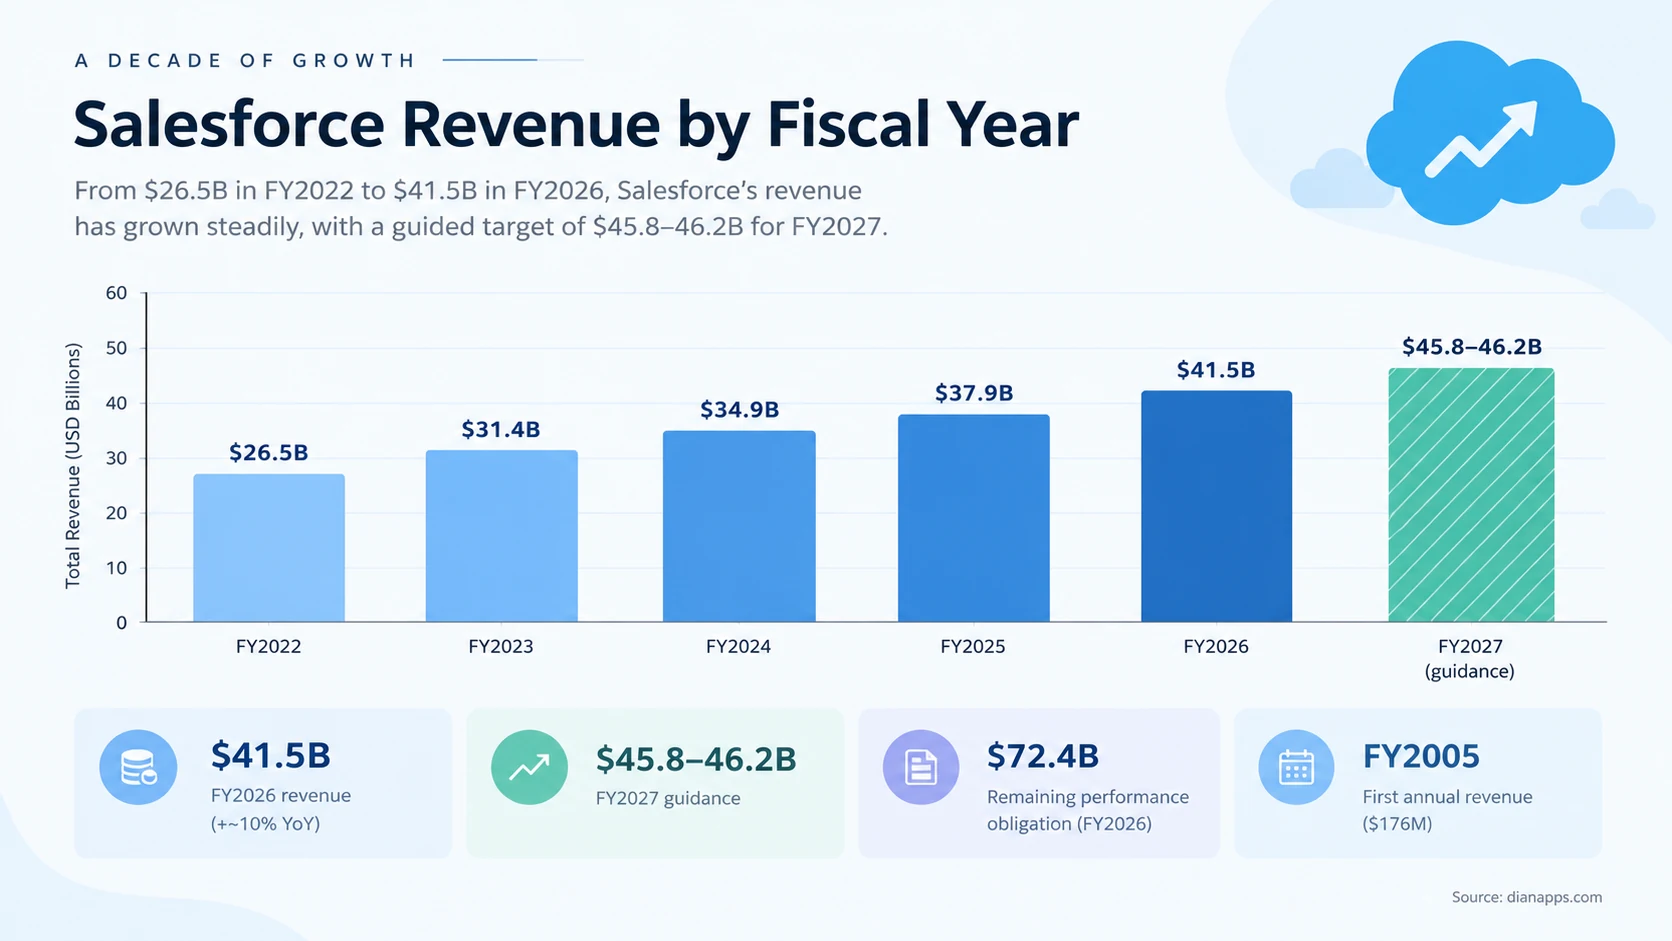
- Salesforce generated $41.5 billion in FY2026 revenue, up approximately 10% year over year.
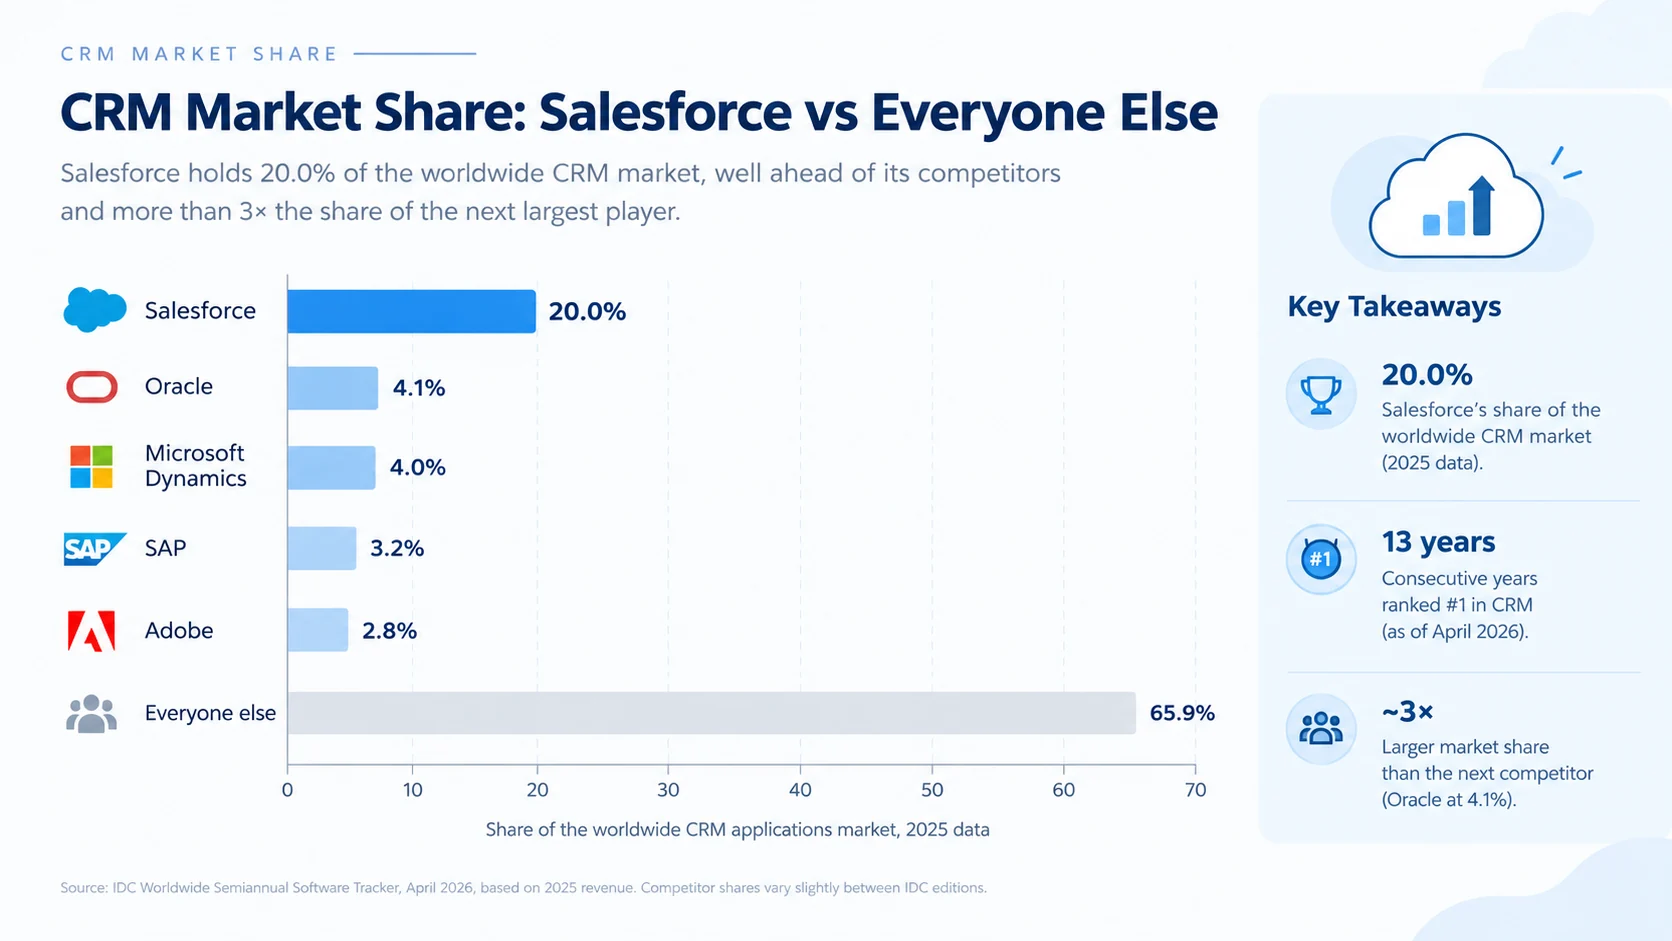
- Salesforce held 20.0% of the worldwide CRM market in 2025 revenue data, ranking #1 for the 13th consecutive year.
- Salesforce reported 150,000+ customers and 83,334 employees as of January 2026, with around 90% of Fortune 500 companies using Salesforce.
- Agentforce ARR reached $1.2 billion as of April 30, 2026, while 29,000+ Agentforce deals had been closed by January 2026.
- Salesforce statistics can vary because of fiscal-year labeling, outdated market-share data, ARR scope, and undated figures, making dates and sources essential when citing them.
Quick Answer: Salesforce generated $41.5 billion in FY2026 revenue and held 20.0% of the worldwide CRM market based on 2025 revenue data. The company had more than 150,000 customers and 83,334 employees, while Agentforce reached $1.2 billion in ARR by April 2026. Because Salesforce reports figures across different fiscal years, dates, and scopes, the article recommends checking the period and original source before using any Salesforce statistic.
Most Salesforce statistics pages contradict each other, and the reason is usually mundane: figures get copied between articles without their date, their fiscal year, or their scope.
One widely-shared page currently labels $37.9 billion as fiscal 2026 revenue. That’s the fiscal 2025 figure. FY2026 was $41.5 billion.
Every number below carries the date it applies to and where it came from. Where sources genuinely disagree, that’s stated rather than resolved by picking the most flattering figure.
Read This First: Salesforce’s Fiscal Year
Salesforce’s fiscal year ends on 31 January. FY2026 covers February 2025 to January 2026.
That single fact causes most of the confusion in this topic. An article published in mid-2026 quoting “$37.9 billion for 2026” has taken the FY2025 figure and relabelled it. Check which fiscal year any Salesforce revenue figure refers to before you use it.
Revenue and Growth
| Metric | Figure | Period | Source |
|---|---|---|---|
| Total revenue | $41.5bn | FY2026, ended 31 Jan 2026 | Earnings release |
| Year-on-year growth | ~10% | FY2026 vs FY2025 | Earnings release |
| Previous year revenue | $37.9bn | FY2025 | Earnings release |
| Subscription and support | $35.7bn | FY2025 | Earnings release |
| FY2027 guidance | $45.8–46.2bn | Forward-looking | Company guidance |
| Remaining performance obligation | $72.4bn | FY2026 | Earnings release |
| First reported annual revenue | $176m | FY2005 | Historical filings |
The long arc: $176 million in FY2005 to $41.5 billion in FY2026. That’s a 236-fold increase over twenty-one years.
The RPO figure is the one analysts watch. At $72.4 billion, contracted future revenue exceeds annual sales by a wide margin, which is the clearest available signal of revenue stability, and more meaningful than growth rate alone for a maturing company.
CRM Market Share
| Metric | Figure | Period | Source |
|---|---|---|---|
| Worldwide CRM market share | 20.0% | 2025 revenue data | IDC tracker, April 2026 |
| Consecutive years ranked #1 | 13 | As of April 2026 | IDC |
| CRM-specific revenue | $21.6bn | 2024 data | IDC |
| Nearest competitors | Oracle ~4.1%, Microsoft Dynamics ~4.0% | 2025 data | IDC tracker, April 2026 |
The comparison that matters: Salesforce’s CRM revenue exceeds Oracle, Microsoft, SAP and Adobe combined. No competitor holds more than about a quarter of its share.
Two honest caveats.
Share is drifting down slightly: 21.7%, then 20.7%, now 20.0% across successive IDC editions. That’s not decline; the market is growing faster than Salesforce is. But articles quoting 21.7% as current are two tracker editions behind.
Competitor shares vary between IDC editions. One April 2026 source puts Microsoft Dynamics at 5.2%; another puts it at 4.0% with Oracle ahead at 4.1%. Treat the exact ordering below Salesforce as approximate.
IDC also ranks Salesforce #1 in Sales (13th consecutive year), Customer Service (12th), and Marketing (6th), and across North America, Latin America, Western Europe, and Asia-Pacific, including Japan.
Customers and Users
| Metric | Figure | Notes |
|---|---|---|
| Total customers | 150,000+ | Directional company disclosure, not an audited KPI |
| Fortune 500 penetration | ~90% | Company reporting |
| Fortune 100 using Data 360 / AI | 50% | FY2025 |
| Customers with fewer than 50 employees | 49% | Third-party analysis |
| Detected deployments at companies ≤10 employees | 31.4% | Third-party domain analysis, 2026 |
Worth Flagging Honestly: the 150,000+ customer figure is disclosed directionally by Salesforce and isn’t a precisely audited metric. It’s been quoted at “150,000+” for several years, so treat it as a floor rather than a current count.
The counterintuitive statistic is the small-business one. Salesforce is perceived as enterprise software, and roughly half its customers have fewer than fifty employees. Both things are true: enterprise accounts drive revenue, small accounts drive customer count.
That ecosystem also creates a large pool of certified talent, and Salesforce certifications remain one of the formal ways professionals validate platform expertise.
Need Salesforce Experts?
Hire experienced Salesforce developers to build and scale your CRM.
Related: Salesforce for startups and SMBs
Agentforce and AI Adoption
The fastest-moving numbers here, and the ones most likely to be stale wherever you read them.
| Metric | Figure | As of | Change |
|---|---|---|---|
| Agentforce deals closed | 29,000+ | 31 Jan 2026 (FY26 Q4) | +50% quarter-on-quarter |
| Agentforce ARR | $1.2bn | 30 April 2026 (Q1 FY27) | - |
| Agentforce ARR | $800m | FY2026 full year | +169% year-on-year |
| Agentforce + Data 360 combined ARR | ~$1.4bn | Q3 FY2026 | +114% year-on-year |
| Agentic work units delivered | 2.4bn | FY2026 | - |
Read the scope before quoting any of these. “$1.4 billion” is Agentforce plus Data 360. “$800 million” is Agentforce alone for the full fiscal year. “$1.2 billion” is Agentforce alone, one quarter later. All three are correct, and they measure different things.
- The Context That Matters: Salesforce describes this as the fastest-growing product category in its history. Against $41.5 billion in total revenue, however, Agentforce ARR is still around 3%, significant momentum, not yet a material revenue line.
Related: What is Agentforce · Data 360 explained
Company and Workforce
| Metric | Figure | As of | Source |
|---|---|---|---|
| Employees | 83,334 | 31 Jan 2026 | SEC Form 10-K |
| Previous year | 76,453 | 31 Jan 2025 | SEC Form 10-K |
| Offices | 93 cities | 2026 | Company reporting |
| Founded | 1999 | - | - |
| IPO | 2004, NYSE | - | - |
| Acquisitions | 70+ | Since 2006 | Varies by counting method |
Headcount grew roughly 9% year-on-year, broadly tracking revenue growth, which is a change from the 2023–24 period of restructuring.
Salesforce has made more than 70 acquisitions, and understanding what those companies became helps explain how the current product portfolio was assembled. See all Salesforce acquisitions.
Revenue by Cloud
The structural story of recent years: Service Cloud overtook Sales Cloud. Customer service workloads now pull more subscription revenue than the category Salesforce built its brand on.
That matters beyond trivia; it explains why Agentforce launched service-first, and why service use cases dominate the AI marketing. The money is there.
- A Caveat On Cloud-Level Figures Generally: Salesforce’s segment reporting has changed over time, and product renaming makes year-on-year comparison unreliable. Treat any precise cloud-by-cloud revenue split older than one fiscal year with caution. For a current breakdown of what sits across the Salesforce portfolio, see our guide to Salesforce products.
Related: Salesforce clouds compared
Why Stats Pages Disagree
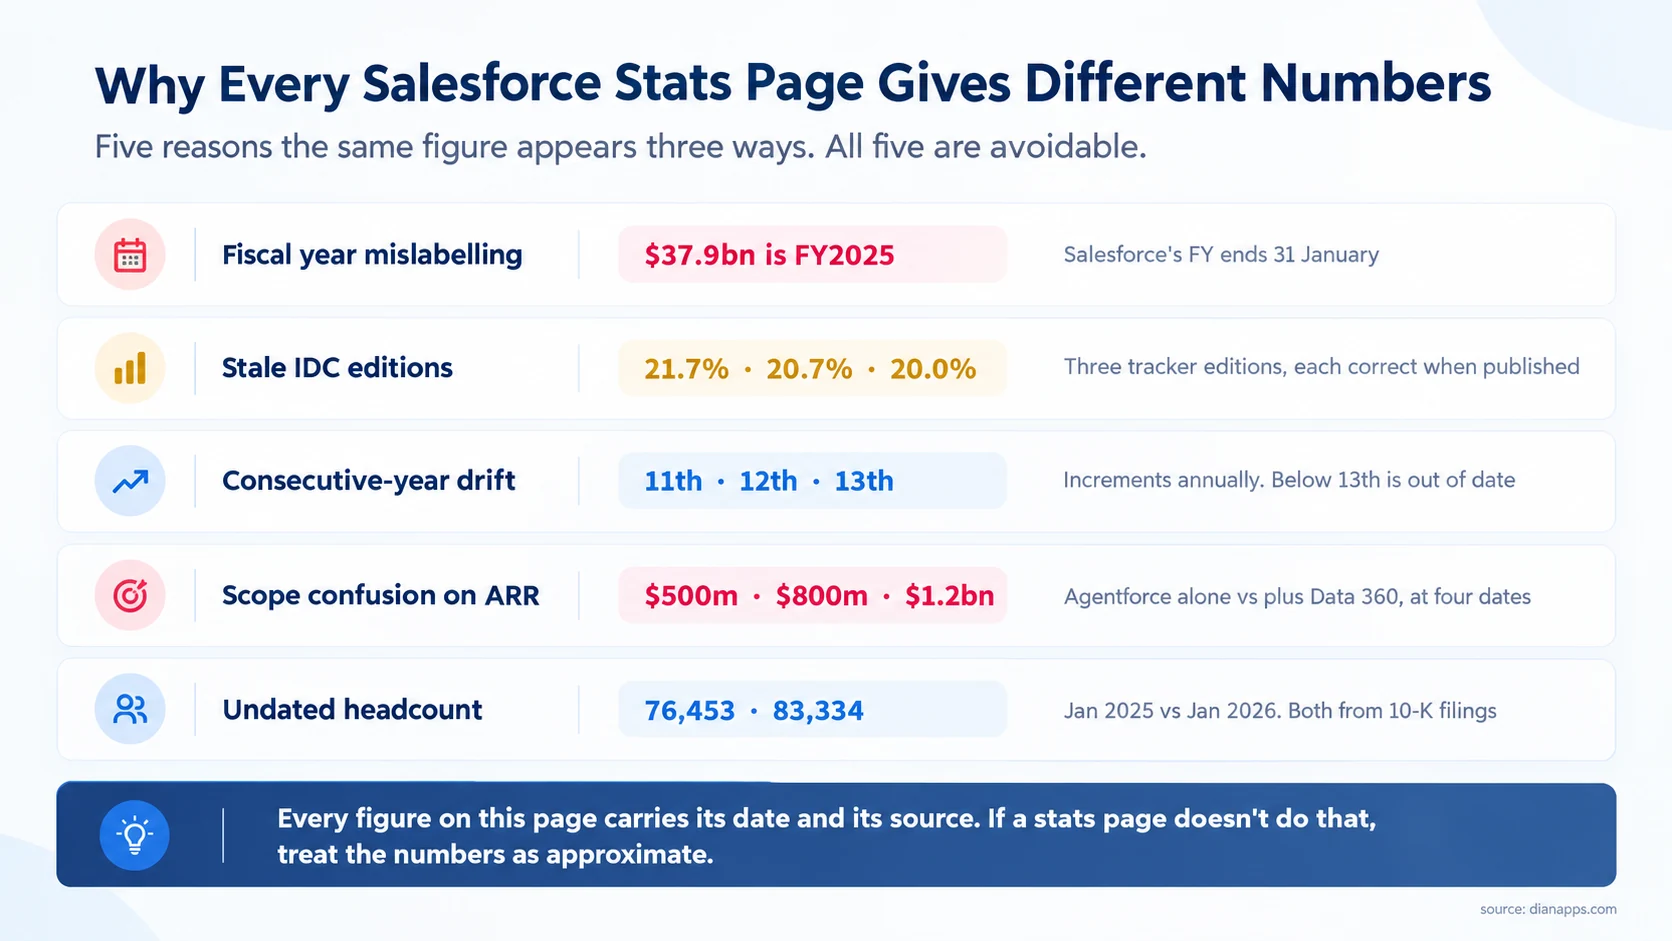
All five are avoidable, and they’re the reason this page dates every figure.
If you’re citing Salesforce statistics anywhere that matters- a board paper, a pitch, a business case- go to the primary source. Salesforce’s investor relations site publishes earnings releases and SEC filings, and IDC’s tracker is the reference for market share. Secondary pages, including this one, should be a starting point rather than the citation.
What These Numbers Mean If You’re Buying
Statistics are only useful if they change a decision. Three that genuinely should.
$72.4 billion in contracted future revenue answers the platform-stability question. A common buyer concern is whether a vendor will still be investing in five years. On this metric, Salesforce is not a risk.
20% market share means the ecosystem is deep. Hiring, partners, AppExchange apps, and community support all follow market share. It’s a real advantage over a smaller CRM regardless of feature comparison. The ecosystem also includes a large learning and talent pipeline, with Salesforce Trailhead providing free training and hands-on learning for people entering or developing within the platform.
Agentforce at ~3% of revenue means it’s early. The marketing is well ahead of the deployment base. If you’re being sold agents as a core reason to buy, ask for reference customers at your scale; 29,000 deals across 150,000 customers is meaningful traction and not yet ubiquity.
Need Clarity Before You Invest?
Get an objective view of your Salesforce costs, requirements, and priorities.
If you’re still evaluating what Salesforce actually is and how the platform fits together, start with our guide to what Salesforce is.
Where to Go Next
For the platform behind the numbers, what is Salesforce and Salesforce clouds compared?
For the AI figures in context, what is Agentforce and Data 360 explained.
For how the portfolio was assembled, every Salesforce acquisition and every Salesforce product.
For what it costs rather than what it earns, Salesforce pricing and editions compared.
For whether it fits your organisation, Salesforce for startups and SMBs and Salesforce alternatives.
For the wider market, CRM market share and CRM statistics.
Numbers Don’t Make the Decision
Market share tells you Salesforce will still exist in five years. It doesn’t tell you whether it fits your processes, what your implementation will cost, or whether a simpler tool would serve you better.
Those are the questions a business case actually turns on, and no statistic answers them.
Have Questions About Salesforce?
Tell us what you’re planning, and our Salesforce team can help you map the next step.
 0 comments








Leave a Comment
Your email address will not be published. Required fields are marked *