















 0 comments





Key Takeaways:
- CRM ROI is cited at $3.10 per $1 spent in Nucleus Research’s 2023 re-analysis, replacing the widely repeated 2014 $8.71 figure.
- 2026 CRM market estimates range widely because research firms use different definitions of the CRM category.
- Around 91% of companies with 10+ employees use a CRM, but actual user adoption within those companies is much lower.
- Published CRM failure rates range from 30% to 70%, with poor user adoption, data quality, and insufficient training identified as recurring causes.
Quick Answer: CRM statistics for 2026 show that the market is widely adopted, but successful implementation still depends heavily on user adoption. CRM ROI is around $3.10 for every $1 spent based on Nucleus Research’s 2023 re-analysis, while 2026 market size estimates range from roughly $84 billion to $126 billion. Published implementation failure rates vary from 30% to 70% because they measure different outcomes, but the recurring issue is poor adoption rather than the software itself.
The most-quoted CRM statistic in the world is twelve years old.
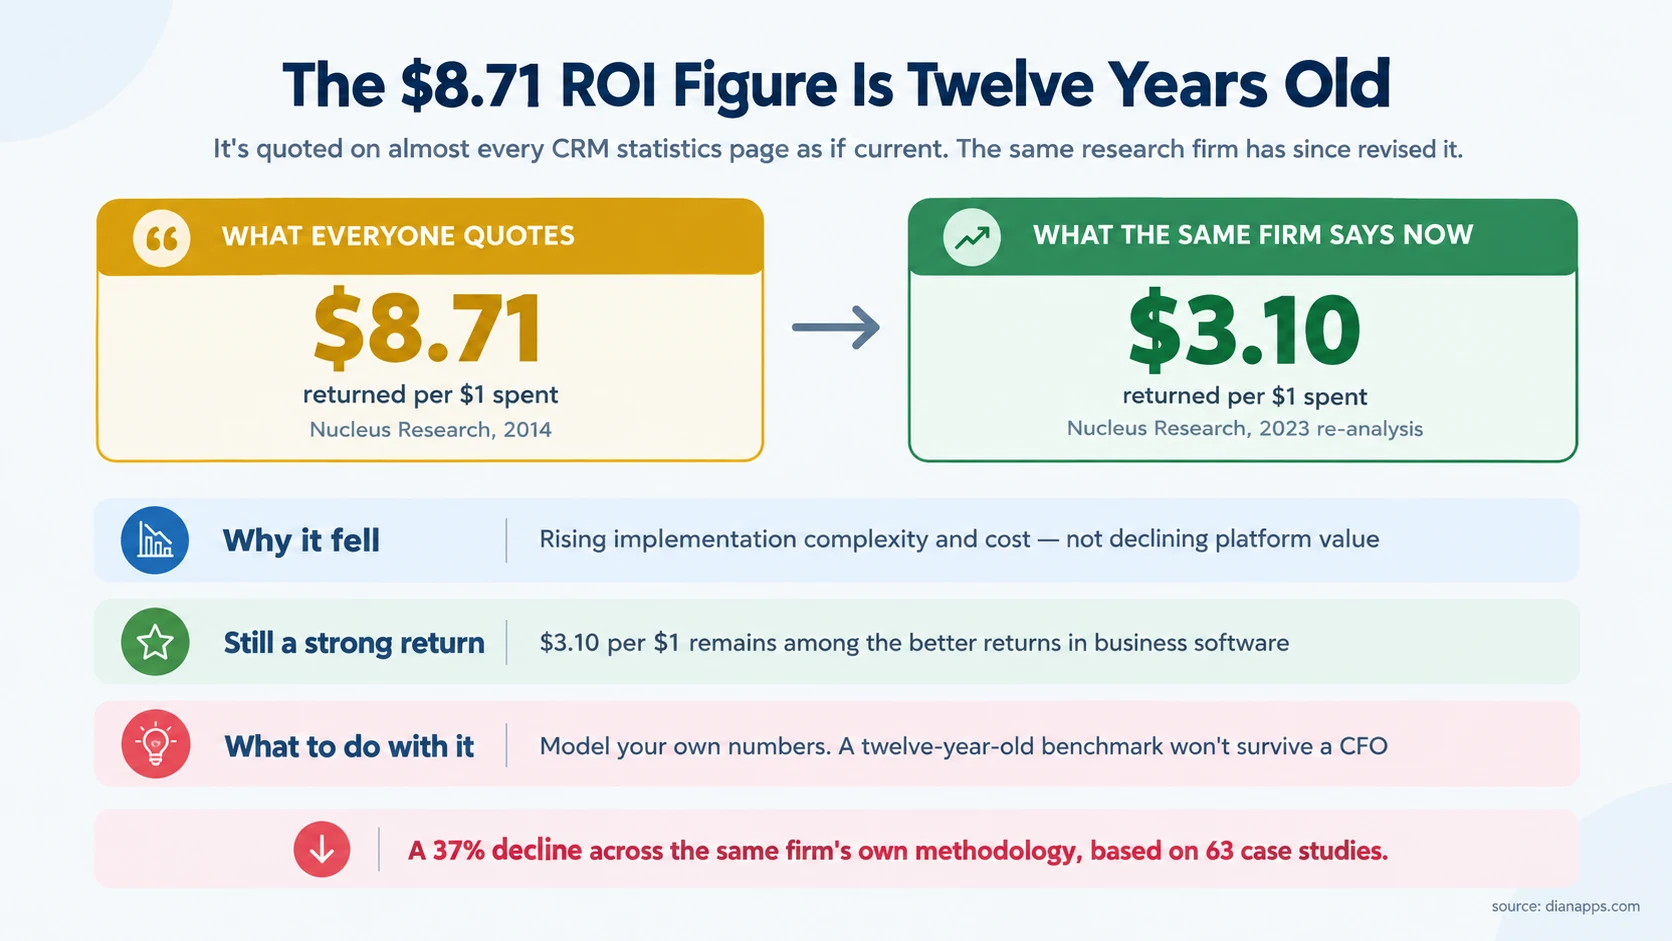
“$8.71 returned for every $1 spent” appears on almost every CRM statistics page as though it describes 2026. It comes from a 2014 Nucleus Research study. The same firm’s 2023 re-analysis of 63 case studies puts the figure at $3.10.
That’s the problem with this topic. Statistics get copied between articles until nobody knows where they came from, and figures that were true a decade ago get presented as current. This issue is especially real for enterprise ecosystem data such as Salesforce market share and ROI statistics, where outdated adoption figures often make it hard to understand current platform growth.
In this guide, every number below carries its source and its date. Where sources genuinely disagree, and on market size and failure rates they disagree enormously, that’s shown rather than resolved by picking a favourite.
The ROI Figure Everyone Gets Wrong
| Figure | Year | Status |
|---|---|---|
| $8.71 per $1 | 2014 | Superseded, still widely quoted |
| $3.10 per $1 | 2023 | Current |
| $13.50 per $1 (CRM + AI) | 2026 | Treat with caution |
Sources: Nucleus Research, Searchlab
Why the decline? Not falling platform value, rising implementation complexity and cost. The software got better, and the projects got more expensive.
$3.10 per $1 is still a strong return by business software standards. The point isn’t that CRM stopped being worth it; it’s that a twelve-year-old benchmark won’t survive a finance director’s review.
If you’re building a business case, model your own numbers. Industry averages are a sanity check, not evidence.
Related: Salesforce ROI: How to calculate and prove it
Market Size: A Range, Not a Number
| Research firm | Base figure | Forecast | CAGR |
|---|---|---|---|
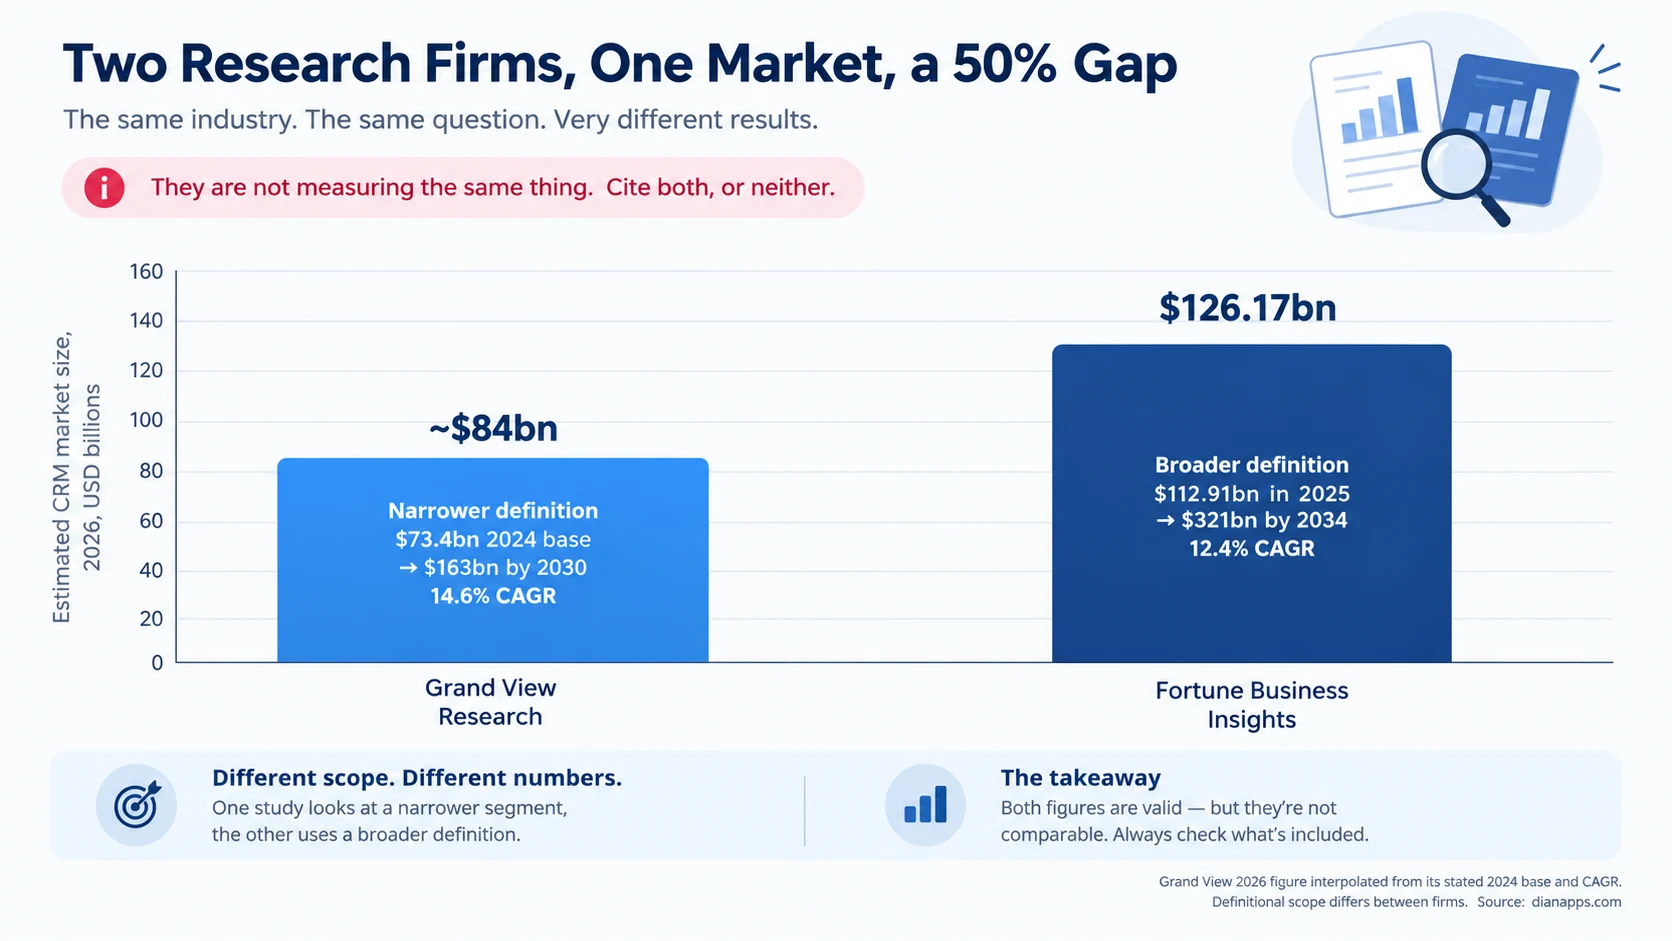
| Grand View Research | $73.4bn (2024) | $163.16bn by 2030 | 14.6% |
| Fortune Business Insights | $112.91bn (2025), $126.17bn (2026) | $320.99bn by 2034 | 12.40% |
| Gartner | ~$128bn (CRM category) | - | - |
These firms are not measuring the same thing. The gap is definitional; what counts as “CRM” varies by whether you include marketing automation, customer service, contact centre, commerce and advertising software.
The practical guidance: cite both with the firm named, or cite neither. A single unattributed market size figure tells a reader nothing, and it’s the fastest way to lose credibility with anyone who checks.
Related: CRM market share by vendor
Adoption Rates
| Statistic | Figure | Note |
|---|---|---|
| Companies with 10+ employees using CRM | ~91% | Widely cited; survey-based |
| Companies with fewer than 10 employees | ~50% | The genuine adoption gap |
| Cloud-based CRM share | ~87% | On-premise is now a minority |
| Organisations using CRM for sales reporting | ~82% | — |
⚠️ Watch for a conflation that appears everywhere. Some pages quote “average CRM adoption rates remain at 26%” alongside the 91% figure without explaining the difference.
They measure completely different things. 91% is company adoption: how many businesses have bought a CRM. The lower figure is user adoption: how many people inside those businesses actually use it consistently.
The second number is the one that predicts whether your implementation works. Buying a CRM is easy. Getting a sales team to use it every day is the entire problem, and it’s why failure rates are what they are.
Struggling With CRM Adoption?
Talk to our Salesforce experts about improving adoption, data quality, and your CRM rollout.
Failure Rates
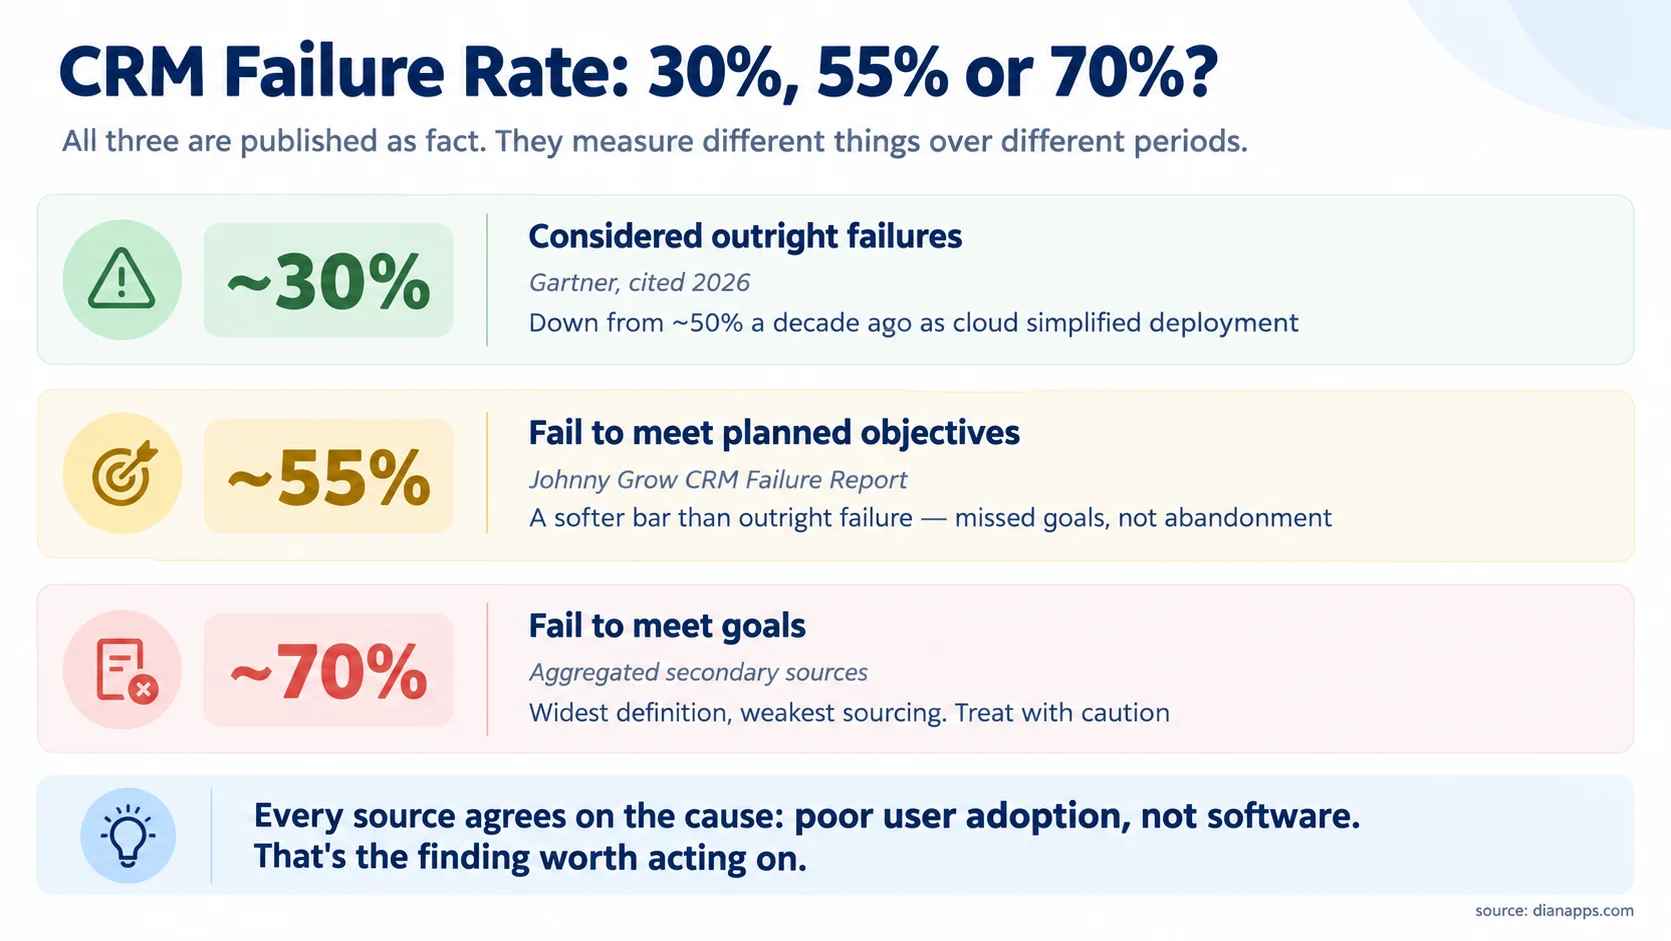
Three figures, all published as fact, all measuring different things:
~30%, outright failures, attributed to Gartner and cited as down from roughly 50% a decade ago. Cloud deployment removed a lot of the technical risk that used to sink projects.
~55%, implementations that fail to meet planned objectives, from Johnny Grow’s CRM Failure Report. A softer bar: missed goals rather than abandonment.
~70%, the widest figure, aggregated from secondary sources with the weakest sourcing chain. Treat with caution.
What every source agrees on: The cause is poor user adoption, not software limitations. Where causes are broken down, the pattern is consistent: user adoption, then data quality, then insufficient training- areas where Salesforce consulting services can help businesses plan and manage the rollout.
That’s the finding worth acting on. If you’re planning an implementation, the risk isn’t picking the wrong product. It’s that nobody uses the right one.
Related: how to choose a Salesforce implementation partner
AI in CRM
The fastest-moving numbers here, and the least reliably sourced.
| Statistic | Figure | Confidence |
|---|---|---|
| CRM platforms with integrated AI capability | ~64% | Moderate, secondary sourcing |
| Companies using AI within their CRM | ~83% | Low, definition of “using” is vague |
| Most-used AI features | Predictive analytics, automated data entry, conversational AI | Directional |
Be sceptical of AI-in-CRM adoption figures generally. “83% of companies use AI in their CRM” is technically true if a spam filter counts. Most vendors now ship some AI capability by default, so availability and active use have diverged sharply.
The more useful question for a buyer isn’t what percentage of companies use AI; it’s what percentage have deployed something that changed a business outcome. Nobody publishes that number, and the honest reason is that it’s much smaller.
Need a Smarter CRM Strategy?
Get Salesforce guidance customized to your workflows, adoption goals, and business requirements.
Related: what is Agentforce · Salesforce statistics
Statistics to Treat With Caution
Some figures circulate widely with no traceable source. These appear on multiple CRM statistics pages, and I could not verify any of them to a primary study:
- “245% increase in revenue” from CRM implementation
- “300% increase in conversion rates” after CRM adoption
- “29% increase in sales”, appears everywhere, original source unclear
- “42% improvement in forecast accuracy”, same issue
They may be true. They may derive from vendor case studies generalised into industry averages. But if a figure has no named study, no sample size and no date, don’t put it in a board paper.
A practical test: if a statistic sounds like a marketing claim, trace it to a named research firm and a year before using it. Most of these don’t survive that.
What the Numbers Mean If You’re Buying
The market size figures don’t matter to you. They’re for investors and vendors. A $126 billion category tells you nothing about whether CRM suits your business. If Salesforce is the platform you’re evaluating, the next question is which cloud actually fits your business. Our Salesforce clouds comparison breaks down the different clouds and what each one is designed to handle.
The ROI figure matters as a sanity check. $3.10 per $1 is a reasonable benchmark to test your own model against. If your business case projects far more, check your assumptions.
The failure rate figures matter most. Whether it’s 30% or 55%, a substantial proportion of implementations disappoint, and the cause is consistently adoption rather than software. That should change how you budget: more on training, change management, and data quality; less on features.
The adoption gap tells you where to focus. Company adoption is 91%; consistent user adoption is far lower. The gap between those two numbers is the whole problem.
Need Salesforce Developers?
Hire experienced Salesforce developers to build, customize, and scale your CRM.
Related: Salesforce vs custom CRM · signs you’ve outgrown your CRM
Where to Go Next
For vendor-level competitive data, CRM market share 2026.
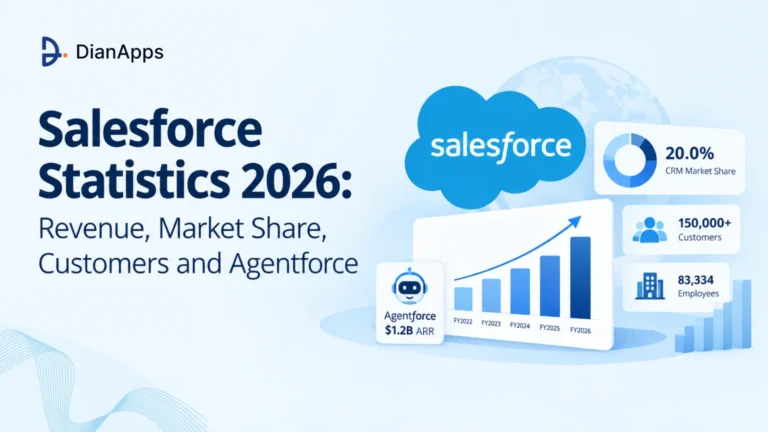
For Salesforce’s own numbers, Salesforce statistics 2026.
For calculating your own return rather than using an industry average, Salesforce ROI and Salesforce pricing.
For avoiding the failure modes in the data, how to choose a Salesforce implementation partner.
For deciding whether you need a CRM at all, Salesforce vs custom CRM, Salesforce alternatives and signs you’ve outgrown your CRM.
For the platform itself, what is Salesforce?
The Statistic That Should Change Your Plan
Somewhere between 30% and 55% of CRM implementations disappoint, and the cause is almost never the software.
That means the most consequential decision in your project isn’t which product you buy. It’s how much of the budget you protect for training, data quality, and change management- the things that get cut first when a project runs late.
 0 comments







Leave a Comment
Your email address will not be published. Required fields are marked *