


Mobile applications have tremendously become eye candy for people across the globe. There are nearly 6.3 billion smartphone users indicating that mobile downloads and smartphone penetration have no reason to stop them from growing.
However, this change escalated soon after the drastic event of the global pandemic resulting in many more mobile downloads and usage in 2020. Consumers downloaded a total of 218 billion mobile apps when bifurcated, the average download in Google Play was nearly 3.4 million applications while nearly 2.09 million apps were downloaded on the Apple App Store. This has resulted in many potential shifts in the way of maintaining existing business operations by going digital mobile-first and cloud-based cross-platform app development solutions.
Time over time, the popularity of mobile apps is being talked about on a hyper-focus level. And for good reasons. In the last two years when the world was under COVID-driven lockdown, it was mobile apps that got people’s food delivered at home, aided people by connecting them with doctors, kept them updated about vaccination slots, entertained them with digital content, and kept them connected with the world through social networks.
Mobile apps have, in fact, become the connecting platform between people whether it’s business and their customers, business and other businesses, or customers to customers. It goes without saying that the reach of mobile apps is at an all-time high and unlike a bubble, it is designed to constantly grow. However, the true essence and value of mobile apps can only be gauged by looking into the top mobile app download and usage statistics. The better we understand this movement, the better we would be able to find a place in the space.
So in this article, we are going to deep dive into the many statistics that are defining the mobile app downloads and usage trajectory in 2022.
Mobile App Download Stats 2022
- Global Downloads
We are witnessing a constant y-o-y rise in mobile apps on a global scale. As you can see in the graph below, in a matter of 5 years, the average number of mobile app downloads has increased by more than 55%.

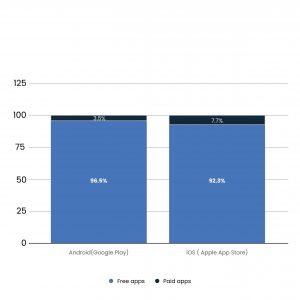
- Paid vs Free Downloads
Even though mobile apps are being touted as one of the most revenue-friendly spaces for a custom software development company, if you look at the trend comparing paid apps with free, you will find that users are more likely to download a free app than a paid one. Now, the hook here is to understand that these “paid” apps have a model which makes users pay for the usage even before they have experienced it.
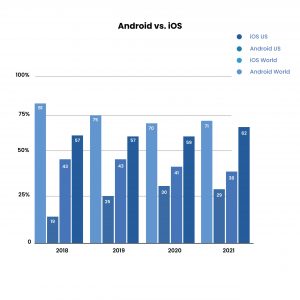
- App Store vs Play Store Downloads
The count of apps available for download in the Play Store continues to be a bigger number than in App Stores. At the time of writing this article, there were 2.87 million apps in the Play Store compared to 1.96 million in the Apple App Store. The number of apps in the leading stores had a similar story writers for hire to share with Android Play Store ruling the space.
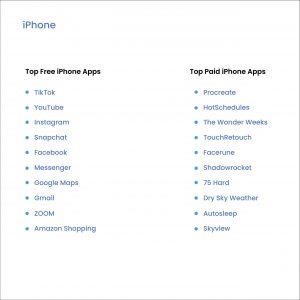
Now, if we delve into it further and look into which out of these were the most downloaded apps, we will get this picture.
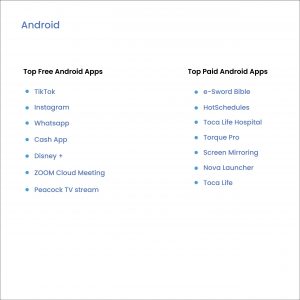
- Top App Stores
While App Store and Play Store continue to be the two go-to app stores in the world, Windows Store is a close third. With over 6,69,000 apps, the store is ahead of Amazon Appstore and BlackBerry World. While we are on this, the use of flutter app development services has also increased as the technology can deploy both android and iOS devices with a single code-base.
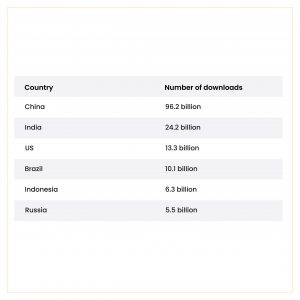
- Countries With Most Downloads
Mobile app usage is omnipresent across the globe. However, when we look into the countries with the most constant app download rates, the list reduces to a limited few. Here are some of those top countries with the maxim download rates –
Mobile App Usage Stats 2022
An average smartphone user spends around 3 hours 10 minutes every day on their device, out of which 2 hours 51 minutes are spent on apps. Let’s dive deeper into the app usage statistics.
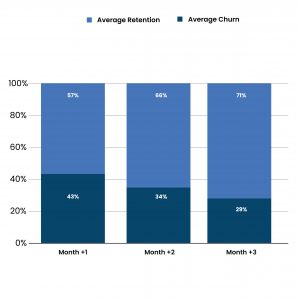
6. App Retention and Churn
The percentage of people leaving the app after installing it is high. While it is expected that there can never be 100% retention but statistics like 71% of users churning within the first 90 days of app installation showcases how businesses should focus on a better experience. An app development company helps you in retaining and churning your app seamlessly
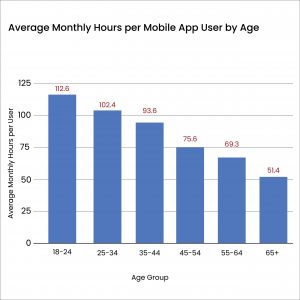
 7. Average App Usage Hours by Age
The comfort with technology adoption varies from age to age. While older people will spend less time on an app, the Gen Z generation spends a lot of time using an app on a monthly level.
8. App Usage by Device Types
It is a general assumption that people use smartphones a lot more than any other device. While it’s true, the number of users using tablets is not too far behind in the case of both free and paid apps.

9. App Usage by Gender
The difference in in-app usage varies greatly between the two genders. While females spend an average of 49% of their time on apps, males spend 39% of their time using mobile applications. The difference in usage is there in the app category as well. Not just mobile phones but also website development is seen a massive hype and usage in the market, accepted by the top website development company.

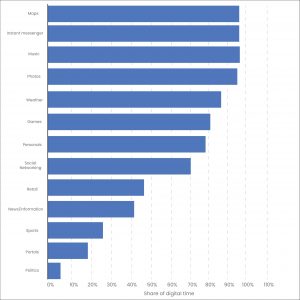
10. Average Time Spent on Apps
Even though users spend their time on multiple apps in their everyday digital interaction journey, there are some categories that are more used than others. For example, 22.2% of the time of an average user is spent on social apps, 19.4% on gaming, 16.4% on communication, and only 1.1% on finance.
11. Top Reasons for Uninstalling Apps
There are a number of reasons, some known and a few unknown, why people uninstall an application. But the top ones of them are:

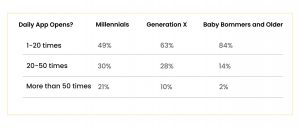
12. Average Time When an App is Opened
On an everyday basis, millennials open an app over 50 times compared to baby boomers, while Gen X is in the middle.
13. Most Common Location for App Usage
Statistics found that over 91% of app users access apps at home while 72% use them at work and 63% use them while shopping. What is interesting is that 78% of the users said they use the app while watching TV.
14. The COVID Impact on App Usage
Since COVID-19, app downloads have increased by 23.3% specifically food delivery, fitness, and work-from-home related software. The two most-used apps across the world at the time when COVID was at its peak were Netflix and Zoom.
So here were the only 15 mobile app download and usage statistics that everyone should know as they step into 2022 full-fledged. We hope that the statistics gave you an idea of what to expect from 2022 if you plan on becoming a part of the mobile space this year by launching your own application. If you are willing to make your first-ever application that gives outstanding results, we can help you in building your software application from scratch. We are a software development company with a team of experienced mobile app developers who can seamlessly help you build brilliance together!
Want to know how to use these statistics to your advantage? Get in touch with our mobile app development experts today!


Leave a Comment
Your email address will not be published. Required fields are marked *