


While the creation of apps provides excellent ROI and user expansion, it requires acute debugging and troubleshooting of apps in order to identify, analyze, and resolve issues or errors that arise during the development or deployment stage of an application.
Want to find some of the most common debugging and troubleshooting in React Native apps? This blog avails you with the exact explanation you’ve been searching for. Let’s start by understanding what is debugging and troubleshooting, along with the features and checklists that developers must know while building an application.
But we head on to the subject, let’s also first know– if React Native the right platform for your next app.
What is Debugging of React Native apps?
Debugging of React Native apps is the process of identifying and fixing errors, bugs, and issues in the code of a React Native app to ensure that it runs smoothly and functions correctly.
During the development of a React Native app, developers use various debugging techniques and tools to identify and fix errors in the code. Some common techniques include using console.log statements to log the values of variables and objects, setting breakpoints to pause the execution of the code and examine the values of variables and objects, and using the React Native Debugger or other debugging tools to inspect the code and state of the app.
Debugging in React Native can be especially challenging due to the cross-platform nature of the framework and the need to test the app on different devices and platforms. However, effective debugging is crucial for ensuring that the app performs as intended and provides a good user experience.
What is Troubleshooting in React Native apps?
Troubleshooting of React Native apps is the process of identifying and resolving issues or errors that occur in React Native applications. React Native app development is a popular JavaScript framework for building mobile applications, and like any other software, React Native apps may encounter problems or bugs that need to be fixed.
The process of troubleshooting typically involves identifying the root cause of the problem, which can be done by analyzing error messages, logs, and other diagnostic information. Once the root cause is identified, the developer can then work on fixing the problem.
Some common issues that may arise in React Native apps include compatibility issues with different operating systems or devices, performance issues, network connectivity problems, and errors in the code.
To troubleshoot React Native apps, developers can use a variety of tools and techniques, including debugging tools built into the framework, logging frameworks, and external tools for analyzing application performance and diagnosing errors.
Debugging and troubleshooting checklists in React Native apps
Debugging and troubleshooting checklists can help developers identify and resolve issues in their React Native apps more efficiently. Here are some items that can be included in these checklists:
1. Check for error messages:
Look for any error messages that have been logged in the console, and try to identify the source of the error.
2. Check for syntax errors:
Look for syntax errors in your code, such as missing brackets or semicolons, which can cause unexpected behavior.
3. Check for logic errors:
Check for issues in the app’s logic, such as incorrect variable assignments or function calls, that could be causing unexpected behavior.
4. Check for memory leaks:
Check for memory leaks in the app’s code, which can cause the app to crash or slow down.
5. Check for network connectivity issues:
Check for issues with network connectivity that could be causing the app to behave unexpectedly or fail to load data.
6. Test the app on multiple devices:
Test the app on various devices to identify any issues that may be specific to certain devices or screen sizes.
7. Check for compatibility issues:
Check for compatibility issues with different versions of React Native, iOS, or Android that could be causing unexpected behavior.
8. Review third-party libraries:
Review any third-party libraries or dependencies being used in the app, and ensure they are up-to-date and compatible with the app.
9. Use debugging and troubleshooting tools:
Utilize the various debugging and troubleshooting tools available, which we will be covering in the next segment, to help identify and resolve issues.
By following a checklist like this, developers can ensure that they cover all the essential steps in the debugging and troubleshooting process and identify and resolve issues more efficiently. However, if you already have an existing React Native application and want to improve the app’s performance then read here!
Now that we have covered the checklist of debugging and troubleshooting React Native apps, let’s move on to how to install React Native debugger along with its key features in the next section.
Steps to install the React Native debugger
To install the React Native debugger, follow these steps:
- Make sure you have Node.js installed on your computer. You can download it from the official Node.js website: https://nodejs.org/en/download/
- Install the React Native CLI by running the following command in your terminal:
|
1 |
npm install -g react-native-cli |
3. Install the React Native Debugger package by running the following command in your terminal:
|
1 |
brew update && brew cask install react-native-debugger |
Note: This command assumes you are using macOS and have Homebrew installed. If you’re using a different operating system or package manager, you may need to adjust the command accordingly.
For macOS, you can use Homebrew Cask to install:
|
1 2 3 |
<Homebrew 2.6.0 brew update && brew install --cask react-native-debugger |
|
1 2 3 |
>=Homebrew 2.6.0 brew install --cask react-native-debugger |
4. Once the installation is complete, you can launch the React Native Debugger by running the following command in your terminal:
|
1 |
open “rndebugger://set-debugger-loc?hot=localhost&port=8081” |
5. Open your React Native project and start the development server by running the following command in a new terminal window:
react-native start
6. In your app code, add the following line of code to enable remote debugging.
|
1 2 |
import { enableDebugger } from ‘react-native-debugger-overlay’ ; enableDebugger () ; |
7. Reload your app and you should see the React Native Debugger window appear. You can use it to debug your app’s JavaScript code, inspect elements, and more.
That’s it! You should now have the React Native Debugger installed and running.
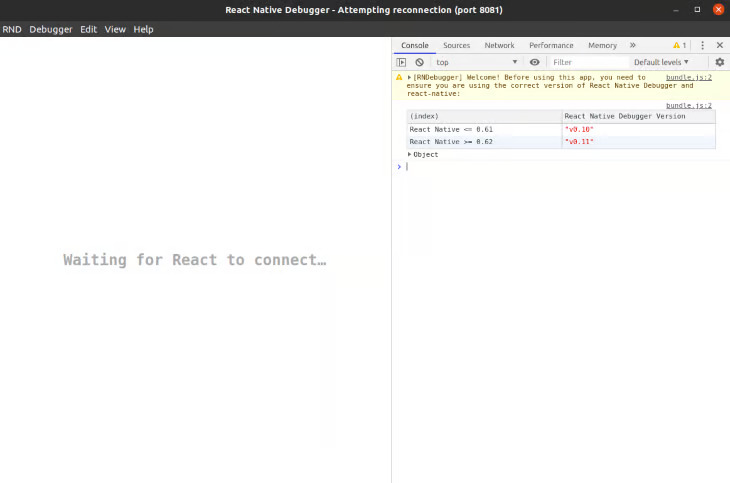
Connecting a React Native App to React Native Debugger
To connect your React Native app to the React Native Debugger, follow these steps:
- Launch the React Native Debugger on your computer. You can do this by running the command open “rndebugger://set-debugger-loc?host=localhost&port=8081” in your terminal.
- Open your React Native app in the iOS or Android emulator, or on a physical device.
- Press Command+D on iOS or Command+M on Android to open the developer menu.
- Select “Debug JS Remotely” from the developer menu.
- The React Native Debugger should now connect to your app and open in a new window. You can use the debugger to debug your app’s JavaScript code, inspect elements, and more.
Note: If you’re using an Android emulator and the developer menu does not appear when you press Command+M, try running the command ‘adb shell input keyevent 82’ in your terminal to open the developer menu.
That’s it! You should now be able to connect your React Native app to the React Native Debugger and start debugging your code.
Key features of debugging of React Native apps
Debugging is an essential aspect of troubleshooting React Native apps. Here are some of the key features of debugging in React Native along with code snippets:
1. Debugging JavaScript code:
You can set breakpoints in your code using the Chrome DevTools in React Native Debugger. Here’s an example of setting a breakpoint in a React component:
|
1 2 3 4 5 6 7 8 9 10 11 12 13 |
import React from 'react'; import { Text } from 'react-native'; const App = () => { const name = 'John Doe'; console.log(`Hello, ${name}!`); return ( <Text>Hello, {name}!</Text> ); }; export default App; |
In the above example, we’re logging a message to the console and rendering a text component. We can set a breakpoint on the line with the console.log statement by clicking on the line number in the Chrome DevTools. When the breakpoint is hit, we can inspect the value of the name and step through the code.
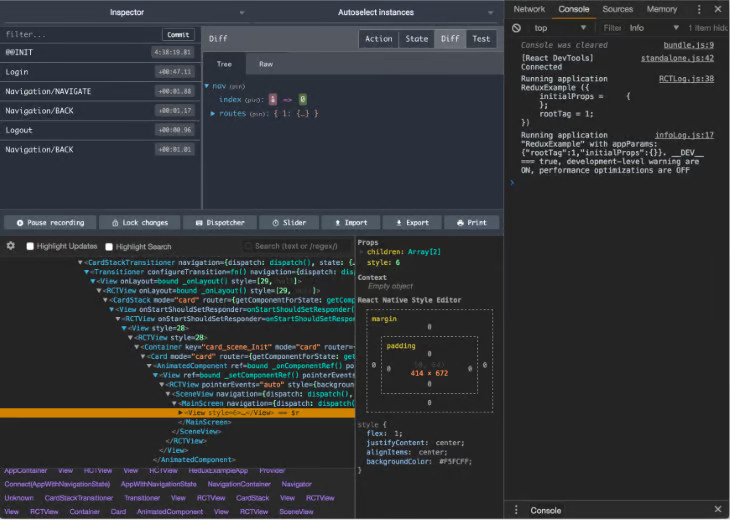
2. Inspecting elements:
React Native Debugger allows you to inspect the hierarchy of React components in your app. Here’s an example of inspecting a component:
|
1 2 3 4 5 6 7 8 9 10 11 12 13 14 15 |
import React from 'react'; import { View, Text } from 'react-native'; const App = () => { return ( <View style={{ flex: 1, justifyContent: 'center', alignItems: 'center' }}> <Text>Hello, world!</Text> </View> ); }; export default App; |
In the above example, we’re rendering a view with a text component. We can inspect the properties of the view by clicking on it in the React Native Debugger. This allows us to see the value of the style property, as well as any other props that were passed to the view.
3. Network debugging:
React Native Debugger allows you to monitor network requests made by your app. Here’s an example of monitoring a request:
|
1 2 3 4 5 6 7 8 9 10 11 12 13 14 15 16 17 18 19 20 21 22 23 |
import React, { useEffect, useState } from 'react'; import { View, Text } from 'react-native'; const App = () => { const [data, setData] = useState(null); useEffect(() => { fetch('https://jsonplaceholder.typicode.com/todos/1') .then(response => response.json()) .then(json => setData(json)); }, []); return ( <View style={{ flex: 1, justifyContent: 'center', alignItems: 'center' }}> {data ? ( <Text>{data.title}</Text> ) : ( <Text>Loading...</Text> )} </View> ); }; export default App; |
In the above example, we’re fetching data from a REST API and rendering it in a text component. We can monitor the network request by clicking on the “Network” tab in the React Native Debugger. This allows us to see the request and response headers, as well as the content of the response.
4. Console logging:
You can log messages to the console in React Native Debugger. Here’s an example of logging a message:
|
1 2 3 4 5 6 7 8 9 10 11 12 13 14 |
import React, { useEffect } from 'react'; import { Text } from 'react-native'; const App = () => { useEffect(() => { console.log('Component mounted!'); }, []); return ( <Text>Hello, world!</Text> ); }; export default App; |
In the above example, we’re logging a message to the console when the component mounts. We can view the message by clicking on the “Console” tab in the React Native Debugger.
Overall, the debugging features of React Native make it easier for developers to identify and resolve issues in their apps and can save a significant amount of time and effort in the development process.
So we have covered everything about debugging in react native apps, let’s move ahead with the troubleshooting in react native apps in detail below.
Steps to install the React Native troubleshooter
React Native Troubleshooting Tool is an open-source tool that helps you diagnose and solve common issues with React Native projects. To install the React Native Troubleshooting Tool, follow these steps:
1. Open a terminal window in your project directory.
2. Install the troubleshooting tool by running the following command:
npm install -g react-native-troubleshoot
This will install the tool globally on your system.
3. After installation, run the following command to start the tool:
React-native-troubleshoot
This will start the troubleshooting tool in your terminal.
4. The tool will prompt you to select the type of issue you’re experiencing. You can use the arrow keys to navigate the menu and select the issue that best matches your problem.
5. Once you’ve selected the issue, the tool will provide you with a list of potential solutions. You can use the arrow keys to navigate the list and select a solution.
6. Follow the instructions provided by the tool to implement the solution. The tool may provide you with commands to run or files to modify.
7. Once you’ve implemented the solution, run the tool again to confirm that the issue has been resolved. If the issue persists, the tool may provide you with additional solutions to try.
The React Native Troubleshooting Tool can help you solve a variety of common issues, including issues with dependencies, configuration, and build errors. It can also help you diagnose issues with the React Native packager and the Metro bundler.
Connecting React Native apps with React Native troubleshooting
The React Native Troubleshooting Tool is a command-line tool that you can use to diagnose and solve issues with your React Native app. To connect your app to the troubleshooting tool, follow these steps:
1. Open a terminal window in your project directory.
2. Install the React Native Troubleshooting Tool by running the following command:
npm install -g react-native-troubleshoot
3. Start your React Native app in development mode by running the following command in your project directory:
react-native start
4. Open a new terminal window and run the following command to start the React Native Troubleshooting Tool:
React-native-troubleshoot
5. Follow the prompts in the tool to select the issue you’re experiencing and choose a solution.
6. If the tool prompts you to modify a file in your project, use your text editor of choice to open the file and make the necessary changes.
7. If the tool prompts you to run a command, switch back to your original terminal window and run the command.
8. If the tool prompts you to restart your app, stop your app by pressing ‘Ctrl-C’ in your original terminal window, and then restart your app by running the ‘react-native start’ command again.
9. Once you’ve implemented the suggested solutions, switch back to the React Native Troubleshooting Tool and confirm whether the issue has been resolved.
By connecting your React Native app to the React Native Troubleshooting Tool, you can diagnose and solve issues quickly and efficiently. The tool provides solutions for a variety of common issues, including build errors, configuration issues, and dependency problems.
Key Features of troubleshooting in React Native apps
Troubleshooting in React Native apps involves a variety of features that can help developers identify and resolve issues in their applications. Here are some of the critical features of troubleshooting in React Native:
1. Error Reporting:
React Native provides detailed error messages and stack traces that can help developers pinpoint the location and cause of errors in their code.
2. Logging:
React Native provides built-in logging capabilities that allow developers to log information about their app’s behavior, making it easier to track down issues and debug their code.
3. Testing:
React Native provides tools and frameworks for automated testing, including unit testing, integration testing, and end-to-end testing. These can help developers identify issues early in the development process, reducing the time and effort required for troubleshooting.
4. Community support:
React Native has a large and active community of developers who share tips, best practices, and solutions to common problems. This community can be an invaluable resource for troubleshooting and resolving issues in React Native apps.
5. Third-party tools:
There are a variety of third-party tools available for troubleshooting React Native apps, including performance analysis tools, error tracking and monitoring tools, and debugging tools. These tools can provide additional features and capabilities for identifying and resolving issues in React Native apps.
By leveraging these features, developers can minimize the time and effort required to troubleshoot and debug their code, improving the quality and reliability of their apps.
In case you are wondering what will be the cost estimation of building a React Native application? Click here to find out!
Common tools used in debugging and troubleshooting of React Native apps
Wondering why using React Native for mobile app development is good? Well, there are a variety of third-party tools available for debugging and troubleshooting React Native apps, such as Reactotron, Flipper, and Sentry. These tools offer advanced features and capabilities for identifying and resolving issues in React Native apps.
1. Flipper:
Flipper is a desktop debugging tool that provides debugging capabilities for React Native, iOS, and Android apps. It allows developers to inspect and modify the app’s state, as well as view performance metrics and network requests.
2. Reactotron:
Reactotron is a desktop app for inspecting and debugging React Native apps. It provides a wide range of features, including logging, network request tracking, and Redux state inspection.
3. Xcode:
Xcode is the official integrated development environment (IDE) for iOS app development. It provides a suite of debugging and profiling tools, including the ability to set breakpoints, view memory usage, and track performance metrics.
4. Android Studio:
Android Studio is the official IDE for Android app development. It provides a suite of debugging and profiling tools, including the ability to view memory usage, track performance metrics, and analyze network traffic.
5. Chrome Developer Tools:
Chrome Developer Tools is a web development tool that can be used to debug React Native apps running in a web browser. It provides a suite of debugging and profiling tools, including the ability to inspect and modify the app’s state, track network requests, and view performance metrics.
6. Sentry:
Sentry is an error tracking and monitoring tool that can be used to identify and diagnose issues in React Native apps. It provides real-time error notifications, detailed error reports, and the ability to track performance metrics and monitor app usage.
Over to you
Debugging and troubleshooting are crucial parts of the development process of React Native apps. By identifying and resolving issues in the app, developers can ensure that their apps perform optimally and provide a great user experience.
There are several tools and techniques available for debugging and troubleshooting in React Native, such as using console logs, using debugging and profiling tools, and testing the app on multiple devices. In addition, checklists can help developers ensure that they cover all the essential steps in the debugging and troubleshooting process.
However, it’s also essential for developers to continue to learn and stay up-to-date with the latest tools and techniques in the field. This can help them to identify and resolve issues more efficiently, and ensure that their apps continue to perform optimally.
In conclusion, debugging and troubleshooting in React Native apps are critical skills for developers to have. By mastering these skills, developers can create better, more reliable, and more performant apps that provide an excellent user experience.
In case your app requires immediate development for say 10 days, React Native can help you build an app in just 10 days, how? Read here.


Leave a Comment
Your email address will not be published. Required fields are marked *